
With only one month remaining until the end of the year, global markets are still looking to what the FED will do in December. Many of the questions we asked at the beginning of the year remain valid, and today we will take a closer look at what the potential outcome of the FED will have on global markets with a special focus on markets which have seen huge sell-offs this year: COMMODITIES.
Will the FED raise rates in December?
Since early 2015 we publicly stated the FED would not raise at all this year. The FED will meet for the last time in 2015 on December 16th and as of writing, there is now a 78% chance of a rate hike according to the CME 30-day Fed Fund futures, which is often used to express the broader market’s view on the chance of a rate hike. We should note the consensus has been wrong many times in the past; but nevertheless we are monitoring developments here closely.
Should rates remain unchanged at 0.25%, history tells us we may see more uncertainty going into 2016 until a new rate hike cycle takes effect or dare we say it – QE4!
What does history tell us about the current rate environment?
When we look at previous pre and post rate hike cycles, we can gather clues as to what we may see going forward over the next 12-24 months. First off, let’s have a look at the cycles in the modern corporate era:
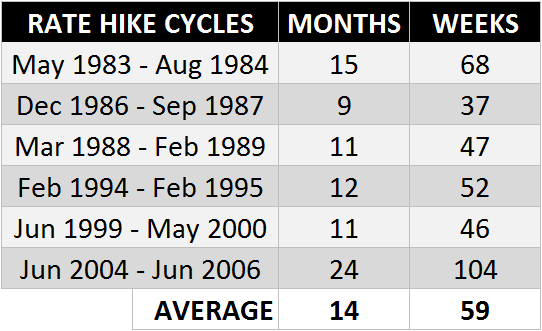
We can see in the table above most rate hike cycles over the last 30 years have lasted for ~1 year with the exception of 2004 – 2006, which lasted 2 years. Looking at the charts for these respective periods, we find some very interesting patterns that may be worth noting:
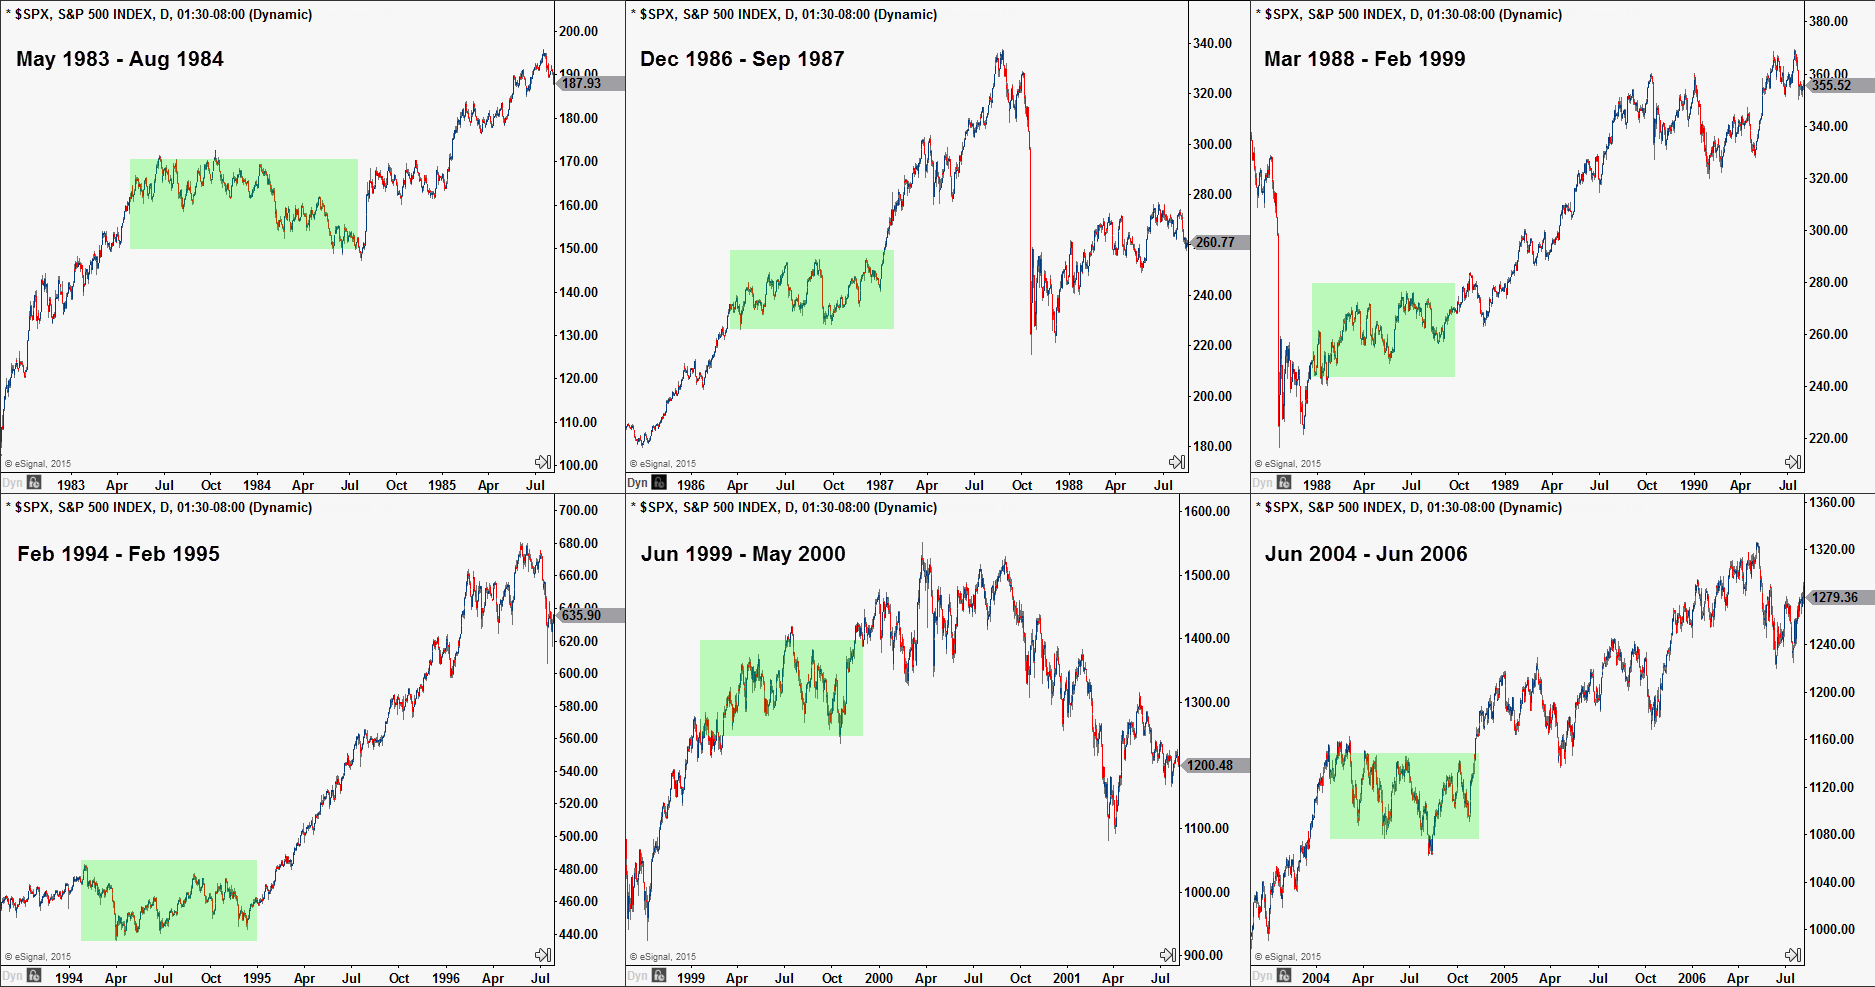
Worth noting are the following points:
- There was plenty of uncertainty and periods of sideways distribution prior to the first rate hike.
- In all but one period (Jun 1999 – May 2000), the S&P500 experienced big advances following the initial rate hike
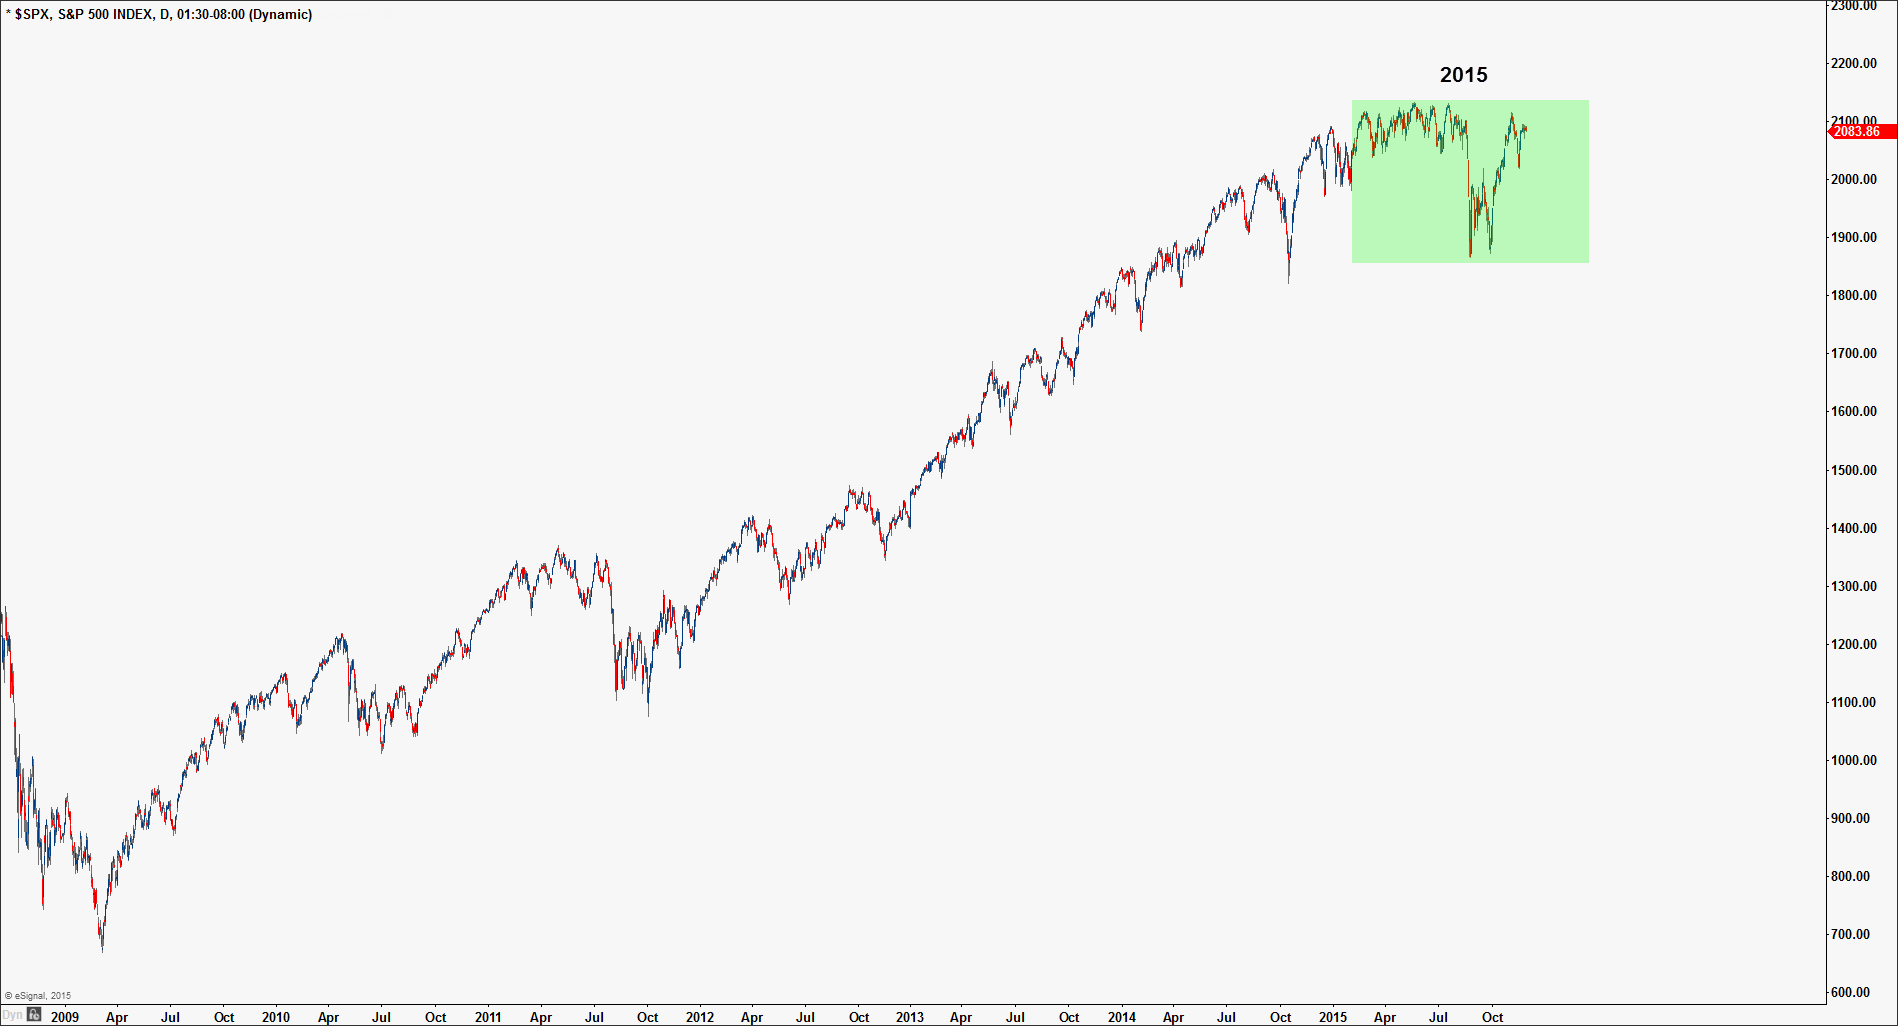
In looking at the chart periods above, the story of 2015 should now make more sense given what we have seen so far. For the most part, 2015 has been a year of uncertainty due to the FED playing coy, major events in the Eurozone earlier this year, and more recently turmoil in China.
So, given where the US stock market sits currently you might want to prepare yourself for:
- What will happen should the FED raise rates this month?
- And just as important- what if they DON’T raise rates?
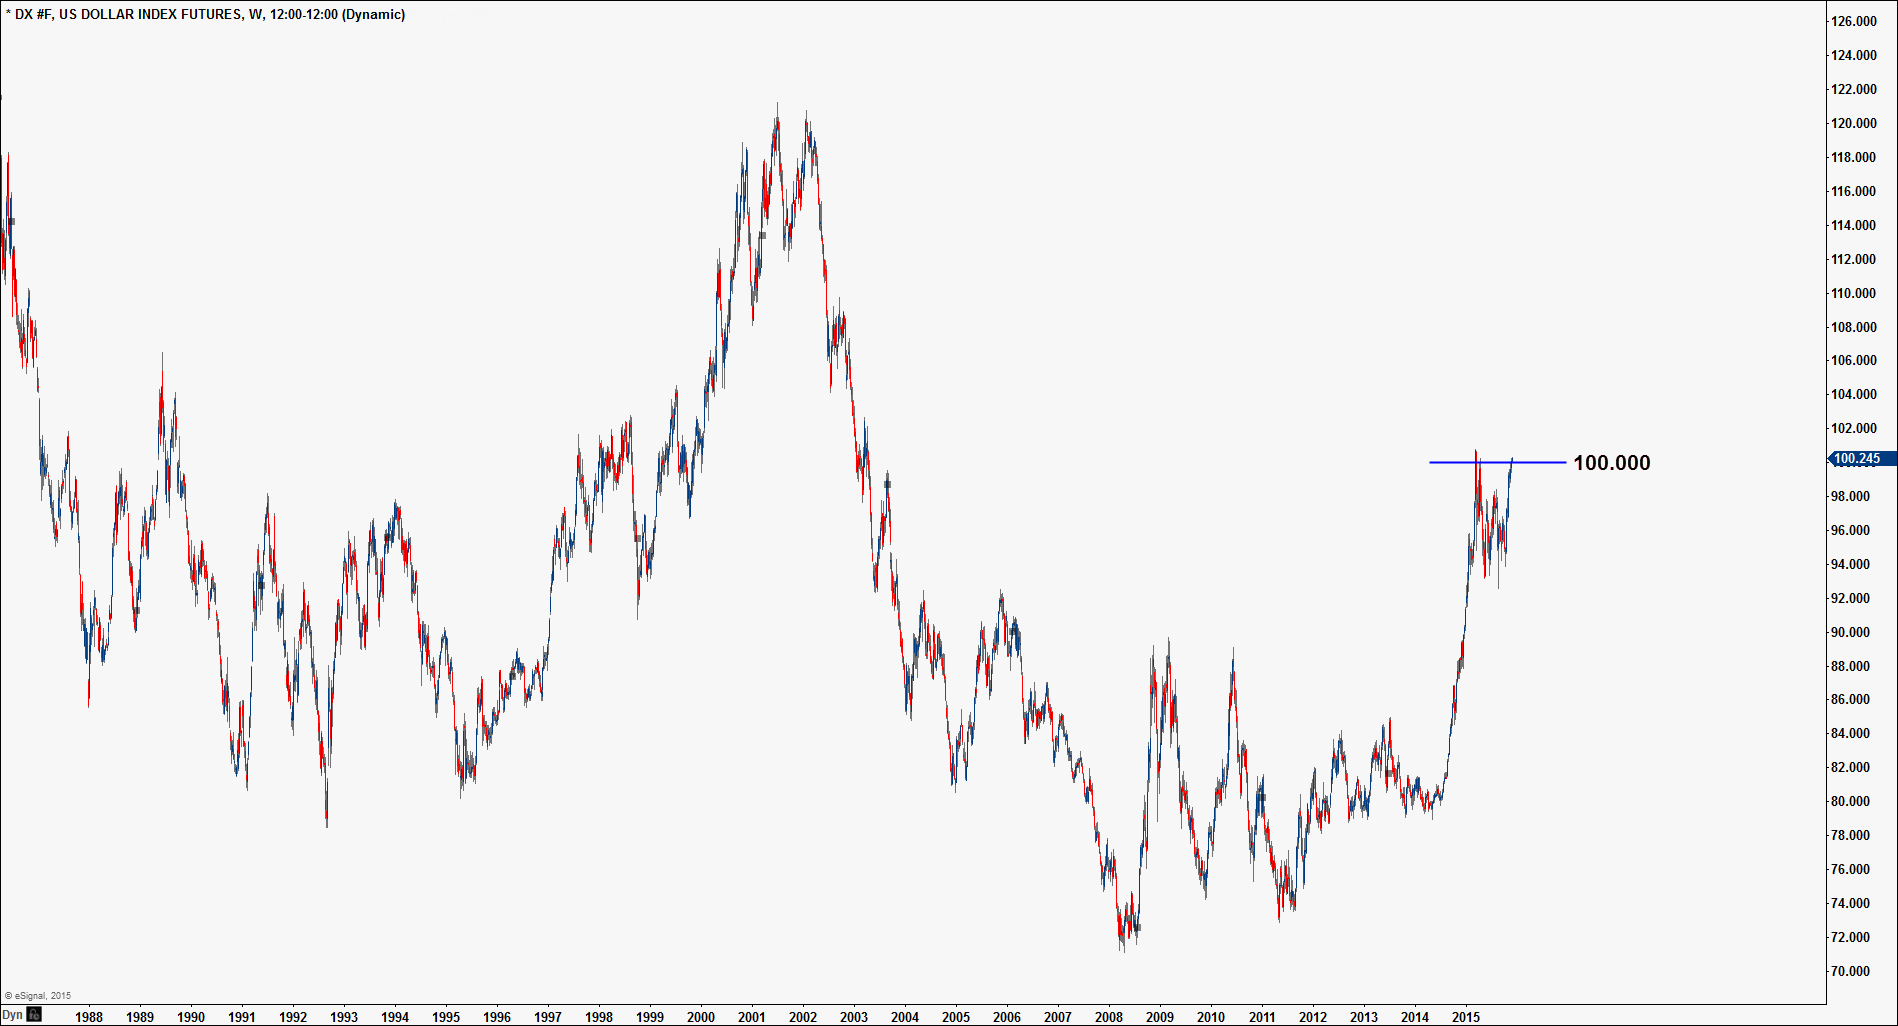
Where is the US Dollar and why is it important?
The US Dollar Index is now at an all-important level of 100. If the US dollar is able able to break this level we could see a substantial move higher. However- given that markets have known of the FED’s intentions to raise rates all year, we ask you this: Have the markets already priced in a rate hike? As traders we must always consider the unexpected, and some of our traders on our desk would not be surprised to see the US dollar top once (if) the FED announces their new monetary policy.
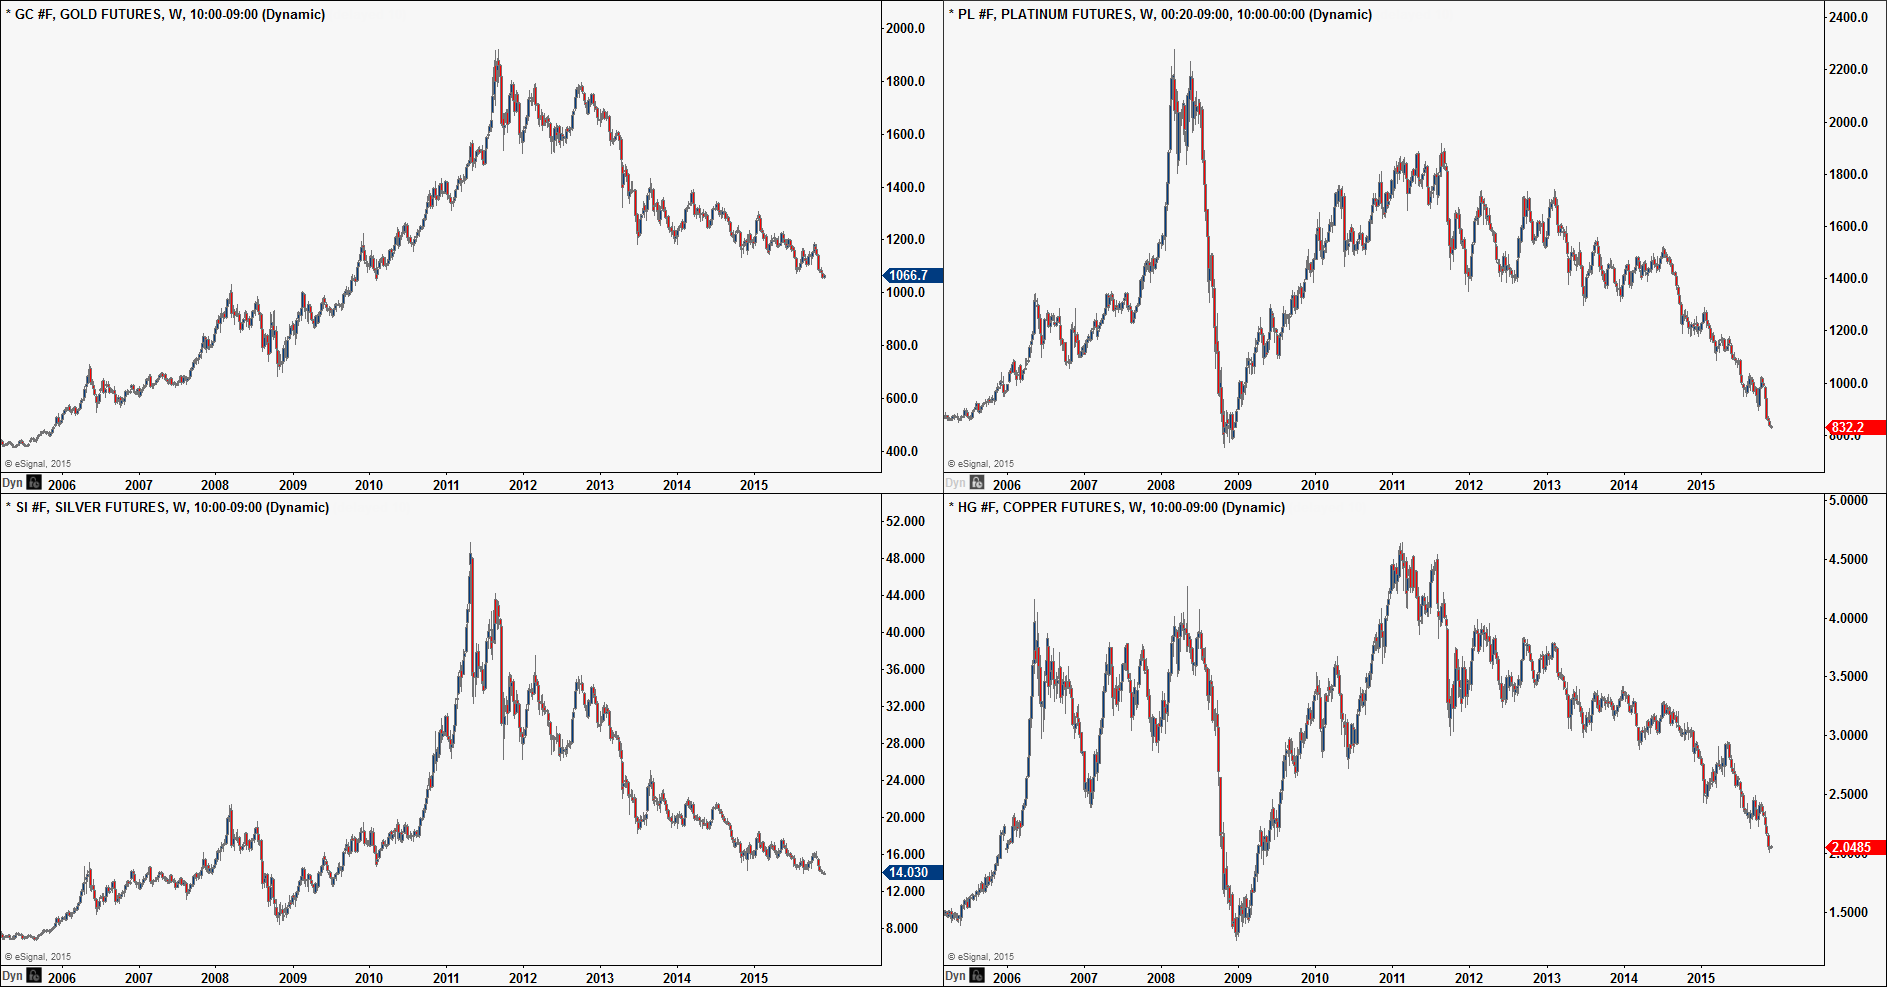
As you may be aware, all of the major commodity contracts are priced in US Dollars and as such the US Dollar has a profound impact on the pricing of commodities. Two of the major commodity markets we track closely are Gold and Crude Oil. On a day-to-day basis, these markets are often inversely correlated to the US Dollar. This means that under normal market conditions, any significant upside move in the US dollar creates downside pressure in these markets (and vice versa).
What does this mean for Gold and Oil?
We have mentioned Gold is in a strong downtrend and the path of least resistance continues to be down. We have also yet to see any extreme pessimism (or fear) in Gold which could be a sign Gold has much lower to go; but like the US Dollar, we are again at some very key long-term levels which could prove very pivotal very soon.
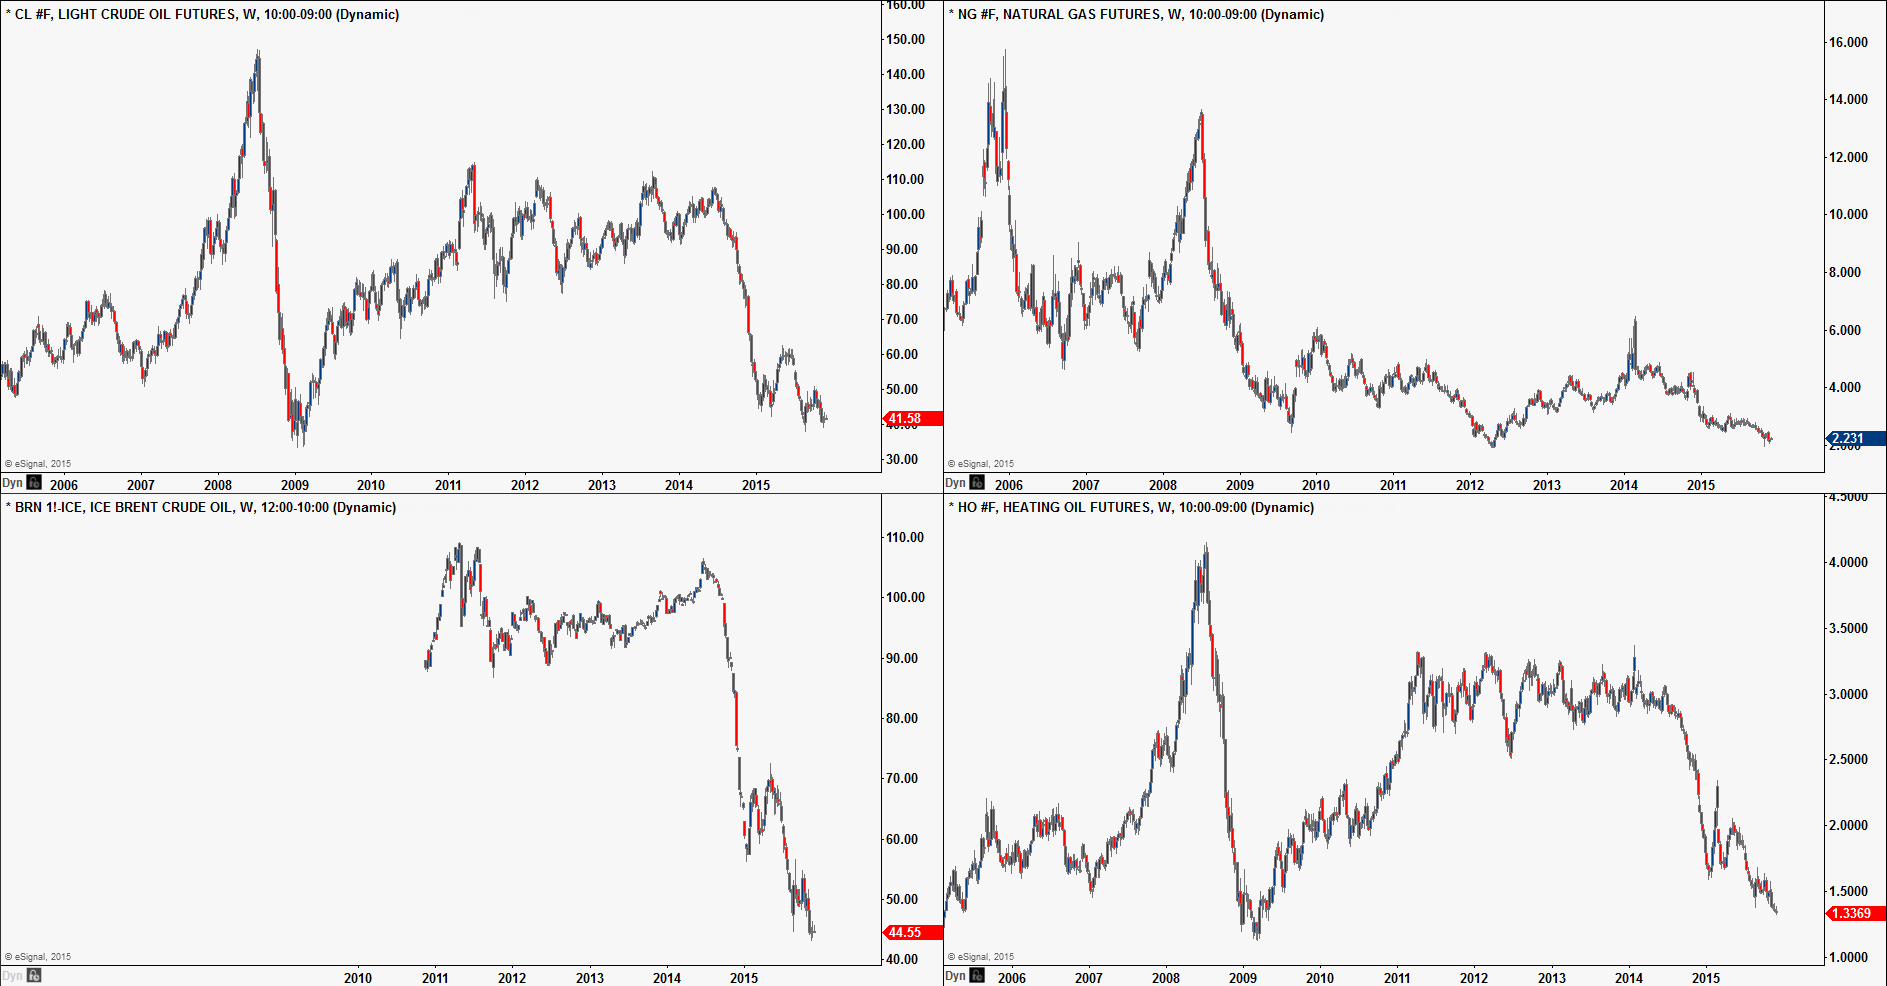
Similarly, Crude Oil has shown signs of basing over the past 3 months. However this does not necessarily mean Crude Oil is about to take off like a rocket and rally higher from here, as history again shows us Crude can often create large bases.
Should the US dollar rally and/or Crude continue to break lower, there could be worrying signs ahead for Oil and the entire energy complex. As the price of Oil is a major driver for many world economies, the two major questions we must now consider is
- Fundamentally- how much lower can Crude Oil go and|
- Are the Metals (above) and the Energy complex (below) lining up for a move higher whilst the US Dollar tops???
With all the above in mind, we ask you these questions:
- Can the US stock market handle an interest rate hike at this point in time (in December)?
- Will the US stock market react positively to a rate hike and head higher from here, or is the bull market coming to an end as per 1999 – 2000?
- Given where we are in the S&P500, will rates create an inflationary effect or will a FED rate hike create deflationary pressure?
- Traditionally a rate hike is bullish for a currency. Does a rate hike mean the US dollar will rocket higher in 2016?
- How will this ultimately affect the price of Commodities now that they are approaching MAJOR support levels?
We will be answering these questions and many more in our Member Portal.
Come and try us for a month, and see us call these markets live as we trade through what’s sure to be an EXPLOSIVE end to the year!