
Pairs Trading Ratio Calibration
Most traders take a directional view on which way they think the markets will go. This usually results in either a profit or loss, or a sideways moving market. Picking the right direction is obviously dependent on what the market does, and getting it wrong is a common result with many traders.
With pairs trading, the element of depending on a market’s direction is eliminated, as it doesn’t matter which way the market goes so long as one of the pairs in the trade is stronger than the other.
One of the proprietary trading strategies that Trade View adopts is CO-ARB, which involves the use of pairs trading or statistical arbitrage which attempts to trade the markets Long and Short, and be as market neutral as possible by capturing the spread variation between the two correlated instruments.
This is usually done by buying a financial instrument which has underperformed, with the belief that it will begin to outperform, and then simultaneously selling an instrument which has outperformed believing that it will now underperform. At Trade View, we use in-house modelling to identify such trade opportunities. Individual traders could also identify these opportunities themselves by looking at the spread divergence between the two pairs on a chart.
It is commonly accepted that either Stocks or Stock Indices are ideal instruments for pairs trading.
If you would like to see Pairs Trading in action, check out the Trading Talk episode below
Examples of Pairs Trading Ratio Calibration
For the purpose of this example we will look at Stock Indices, the reason being, that trading Stocks can expose you to the potential that one of the Stocks can go to zero. Whereas with Stock Indices this is close to eliminated, as for a Stock Index to go to zero all stocks within that Index must also go to zero.
Let’s make a comparison and look at the snapshots of the Dow /S&P500 (1:10 ratio) and FTSE/DAX (1:1 ratio) on the first trading day of 2013, after the full year moves of 2012.
Such a ratio is best described as relative size of your purchase. The way to calculate the relative size is based on price movement of one product compared to another, for example:
If the Dow on average moves by 157 points daily and the S&P moves by 15 points then you could typically buy $1 of the Dow and $10 of the S&P then your ration is 1:10.
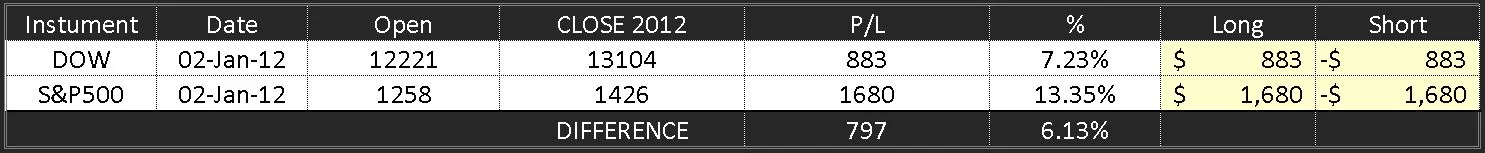
As you can see in Figure 1 below, in 2012 the Dow finished up by 7.23% or 883 points and the S&P500 finished the year up by 13.35% or 168 points. This could lead us to believe that the S&P has outperformed the DOW, which in normal market conditions the correlation between the two should get closer to each other over time.
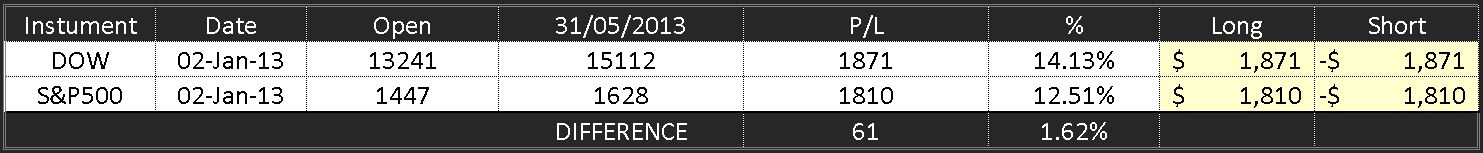
So, on the first day of trading if we decided to Sell (short) the S&P at 1447 and buy (long) the DOW at 13241 (shown in Figure 2), and if we left the trade until today, then we would find that our Profit would be 61 points which is a good amount, but compared to if we decided to Sell the S&P on its own, this would have left us with a very unfavorable 181 point loss, which would not be acceptable in any risk management models we use.
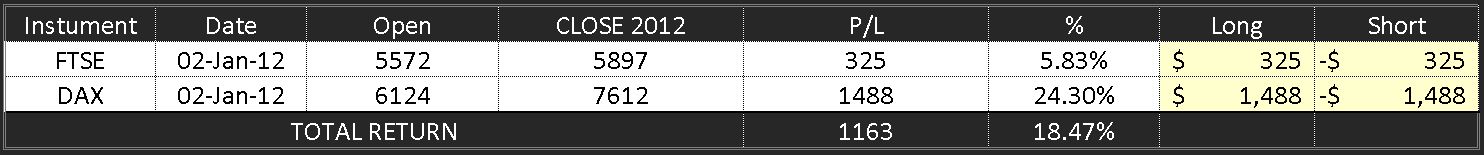
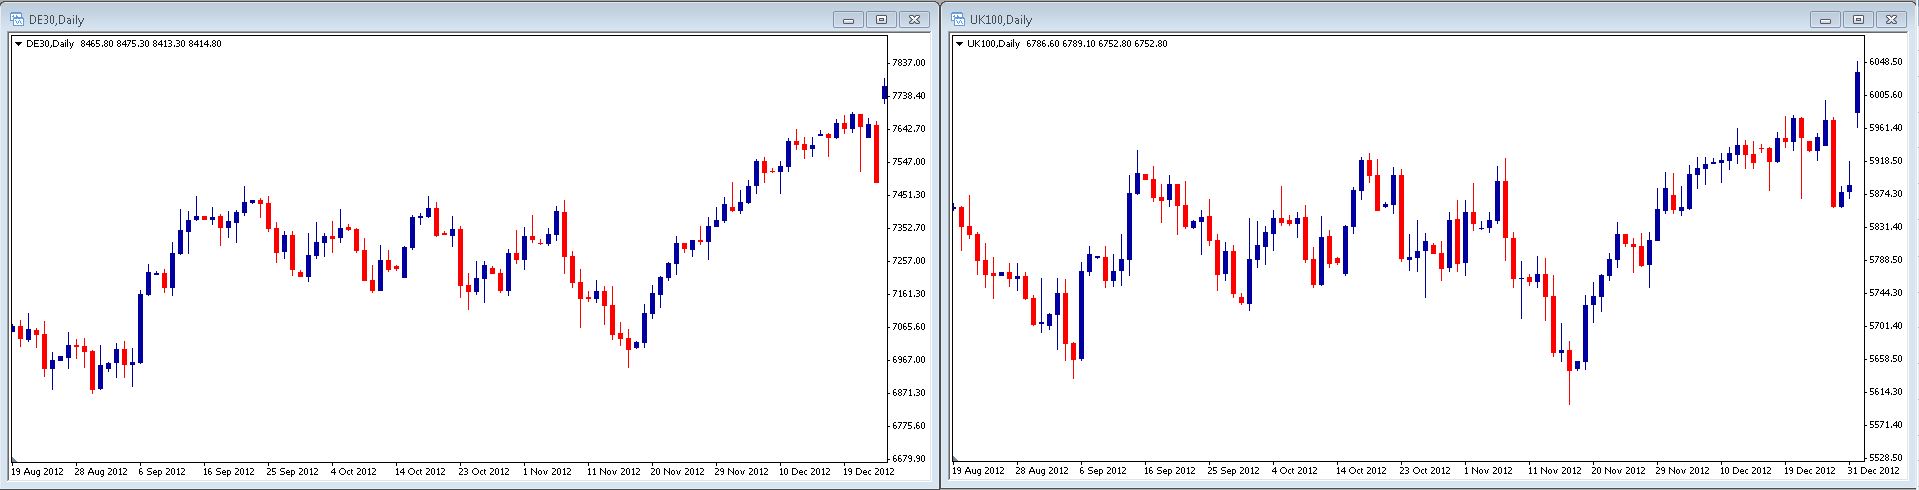
Another example shown in Figure 3 is the FTSE vs the DAX, and you will see that in 2012 the DAX has clearly outperformed and finished up by 24.3% and the FTSE underperformed compared to the DAX by finishing up only 5.83%. Now there is a Spread of 18.47% which in a professional trader’s eyes is seen as a real opportunity.
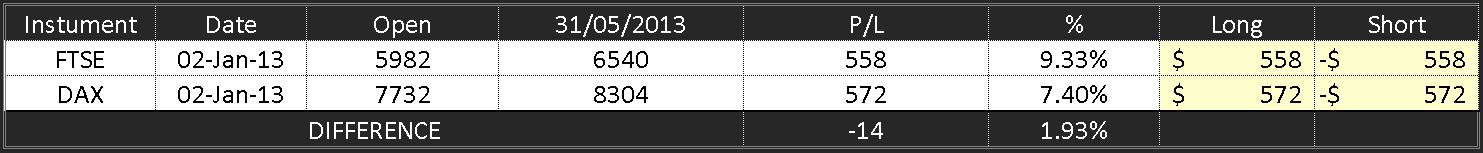
So in this instance, if on the first day of trading in 2013 we decided to Sell the DAX at 7732 and buy the FTSE at 5982 (shown in Figure 4), and if we left the trade until today, then we would find that we are actually in a losing trade of 14 points which is a manageable amount, and our risk exposure was acceptable.
This particular strategy of Pairs Trading tends to have multiple spread swings throughout the year, and this is when traders need to take advantage and try profiting from them.
A great example of this is shown in Figure 5 and 6, where in April the DAX was down by approx 3.19% for the year and the FTSE was up by approx 5.92% for the year. This meant that if we decided to take our profits here then we would have made approx 3.00% on the DAX (as we were short), and made approx 5.00% on the FTSE (as we were long).
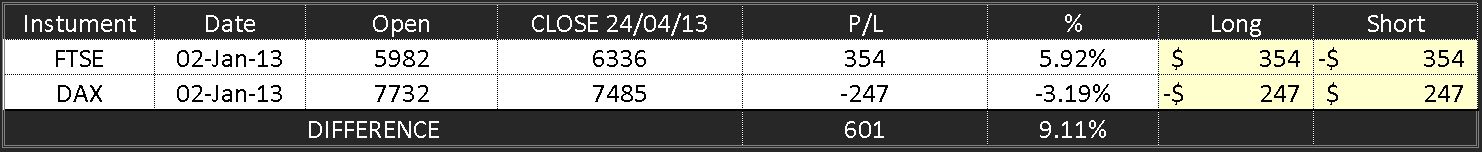
If after closing our positions we decide to re-evaluate this pair we would have seen that these two indices at the time had a spread of 9.11% which indicates a potential reversal of trade.
Now we could go Long the DAX (underperformed) and Short the FTSE (outperformed) expecting that the DAX would catch up on the FTSE gains or vice versa.
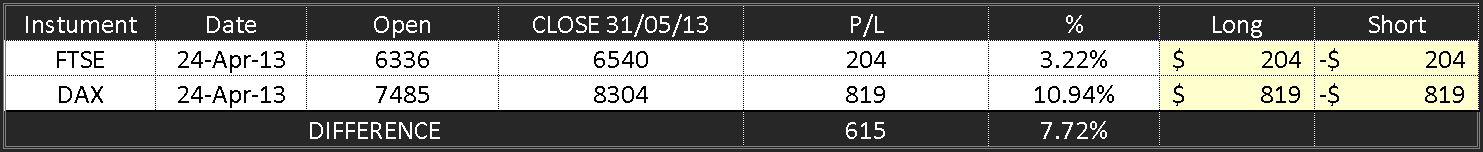
The DAX did catch up to the FTSE gains and it occurred a lot quicker than expected. As of the close at the end of May the DAX is now up by 7.40% which is an increase of approx 10% from April while the FTSE only gained 3.41% to be up by 9.33% for the year.
Therefore in Figure 7, the potential profit would have been 819 points on the DAX and 204 point loss on the FTSE which gives us a potential profit of 615 points. However, it is important to stress the other side of the trades if you had got it wrong. In this example if you traded the DAX short and the FTSE long then you would have lost 615.
By understanding Pairs Trading you could potential avoid the direction as you are always looking for a divergence in spread and looking for an overbought or oversold scenario.
Conclusion
Pairs trading has both advantages and disadvantages, but overall if managed correctly the advantages should far outweigh the disadvantages. This method can be used for short, medium to longer term strategies, and has the potential to eliminate market noise or getting stopped out with extreme market volatility.
The general rule of Pairs Trading is that if you get it wrong, potentially your loss will be lower.
The main disadvantage in trading this type of strategy is that you may not get the direction right on the two trades and you could end up with a loss on both sides of the trade that is greater than expected.
There are other important factors to be aware of before adopting Pairs Trading as a strategy, and we have only outlined some of the basics. Trade View provides a comprehensive understanding of how professional traders utilise Pairs Trading as part of a comprehensive trading strategy in our In-House Systems Building Workshop.
Take a look at the best pairs trading software
Ready to take your Trading to the Next Level?
Trading Talk is a weekly video series where our traders show you concepts, techniques and models that they use on the trading desk.
Individual traders could identify statistical arbitrage opportunities themselves by simply looking at the spread divergence of a pair on a chart, however relying on simply a visual divergence can be an unreliable entry indicator, because the visual spread between 2 instruments on a single chart will change depending on the time period of the chart. For example a 1 month chart of 2 instruments may suggest that instrument Y is overbought and instrument Z is oversold, whereas a 6 month chart may show that instrument Y is oversold and instrument Z is overbought. This is because most charting software will plot 2 instruments on one chart from a single point of reference, which changes depending on the time period of the chart displayed. Therefore relying on visual divergence can be unreliable as an entry indicator for a pairs trade.
A more reliable and consistent way to identify when a pair has diverged, and which instrument to go long/short, is to use a mathematical measure. One example of this is to use a measure of standard deviation of the mean of the price ratio of the pair, to determine how far the pair has diverged from its average price spread.
As an example, let us say that stock ABC is at $40 and stock XYZ is at $20. The current price ratio of the pair is therefore $2 ($40/$20). Let us say that over the past year, the price ratio has fluctuated between $2 and $4. If we chart the price ratio of the pair over a one year period, and overlay this chart with a 100 moving average of the price ratio, the moving average of the price ratio might give us a reading of $3. Therefore, the current price ratio of $2 is below the 100 day average of the price ratio of $3 and presents a pairs trading opportunity. The trade here would be to buy long ABC and sell short XYZ, because the bet is that ABC will outperform XYZ, which will bring the price ratio back towards its mean of $3. With this method, the trader is able to identify which stock to go long and which to go short, eliminating the confusing created by looking at 2 instruments on different time scales on a chart.
Once we have a good indication of the longer term average of the price ratio, we can overlay the price ratio chart with a standard deviation measure to decide when is best to enter or exit a trade using a mathematical measure. Whether you decide to enter a trade when the price ratio hits its first, second or third deviation is up to the trader. But at the very least it provides a consistent method for identifying trading opportunities, beyond relying on the visual divergence shown on a chart. A good rule of thumb is to look at the maximum divergence of the price ratio above and below its mean, over a one year period. If for example the standard deviation of the price ratio of the pair has gone as high as 3.0 standard deviations and as low as -2.5 standard deviations, then these can provide good base signals for entering trades. An appropriate exit strategy might be to close out trades when the price ratio reverts back within 1.0/-1.0 standard deviation from its mean. For example, over the past year, the standard deviation of the price ratio (using a 100 day MA) of DIA (Down Jones ETF) and SPY (S&P500 ETF) has gone as high as 2.84 and as low as -2.74. These numbers provide good entry triggers for this pair going forward.
When looking for good pairs to trade, the first variable to consider is the correlation between the pair. Although high correlation suggests a strong link in price movement between the two instruments, it gives no indication as to how long it might take for the pair that has diverged to revert back to its mean, which means that capital could be tied up in the trade for longer than expected. A good way to measure the frequency with which a pair reverts back to its mean, is to calculate the co-integration coefficient of the pair. As a rule of thumb, I look for pairs with a correlation reading of over 90% and a co-integration reading of above 0.90.
Thanks Daniel for your detailed comment. I certainly agree with you that a more detailed approach is needed to successfully implement Pairs Trading, and this is something we do cover in much more detail in our Advanced Workshops. Using a Mathematically based approach is a must once a person understands the basics of how a pair trade is structured, which was the intended purpose of this article. Thanks again.
Hello, I’m interested in learning more about pairs trading as a strategy. I also attended your webinar with IC Markets about the same, which I found very useful, but I was wondering if you held any classes that focus on pairs trading?
Hi Shane,
I am glad you enjoyed our webinar. Our In house Intermediate Workshop does cover aspects of Pairs Trading.
Please give us a call to discuss further:
https://www.tradeview.com.au/intermediate.php