
Moving averages are one of the first indicators a trader will find and could be considered a beginner indicator, but it’s how you use it that will determine if your strategy is for beginners or advanced traders, and this guide will help you understand how you can take a simple moving average and turn it into a an automated trading portfolio that runs 24/7.
This is what the Moving Averages guide will cover:
- How to use MA’s to follow and trade with the trend
- How to use MA’s to identify value on your chart and trending markets
- How to use MA’s as support and resistance levels
- How to use MA’s to automatically set your stop loss
- How to use MA’s to better time your entries and reduce screen time
- How to use MA’s to ride massive trends in any markets
- How to use moving averages to find divergences
- How to create an automated moving averages trading strategy
- How to build a moving average trading portfolio
How to use MA’s to follow and trade with the trend
The most effective way to use moving averages is to identify the trend and then trade with it. This means buying when prices are above the moving average and selling when prices are below the moving average.
There are a few ways to do this, but the simplest is to just use two moving averages: a short-term MA and a long-term MA. The short-term MA should be set at a time period that is shorter than the long-term MA. For example, you could use a 10-day MA and a 30-day MA.
When the short-term MA crosses above the long-term MA, it indicates that prices are starting to trend up. This is known as a “bullish crossover”. Conversely, when the short-term MA crosses below the long-term MA, it indicates that prices are starting to trend down. This is known as a “bearish crossover”.
The key thing to remember is that you want to trade with the trend. So, if there is a bullish crossover, you would buy when prices close above the short-term MA. And if there is a bearish crossover, you would sell when prices close below the short-term MA.
There are many different ways to use moving averages, so it’s important to do some research and test different strategies before using them in live trading.
Trade View X can help you automate your moving average trading strategy without any coding necessary.
X-Builder allows you to create automated trading strategies for anything you can see on the chart, this includes moving average crossovers, using Drag & Drop blocks instead of complex code.
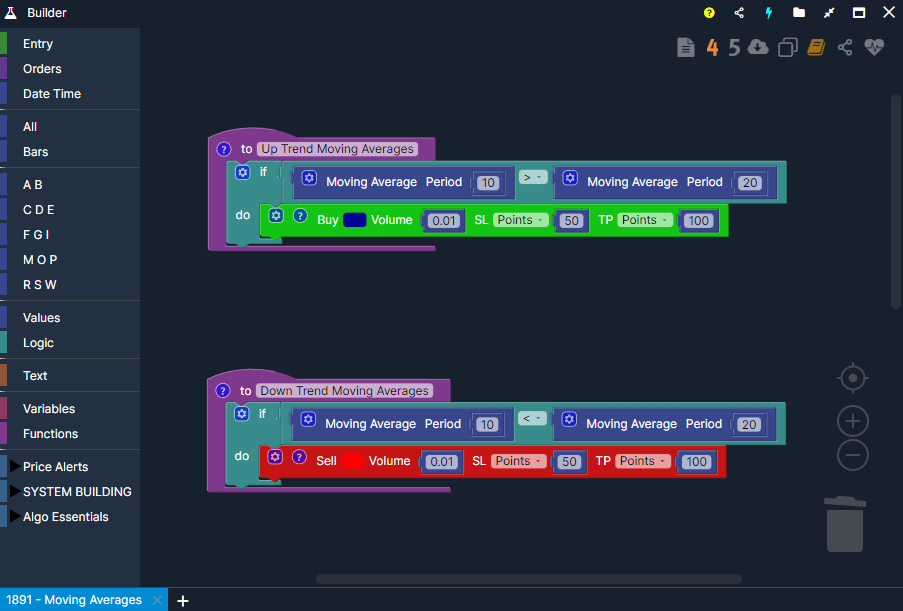
The below image shows a simple system that has been built with blocks that will automate the Moving Average Indicator.
If the moving average 10 is greater than the moving average 20, the system will open a Buy position.
And the opposite for the Sell side, if the moving average 10 is less than the moving average 20, the system will take a Sell position.
How to use MA’s to identify value on your chart and find trending markets
One way to use moving averages is to identify “value areas” on your chart. A value area is simply a range where prices have been consolidating.
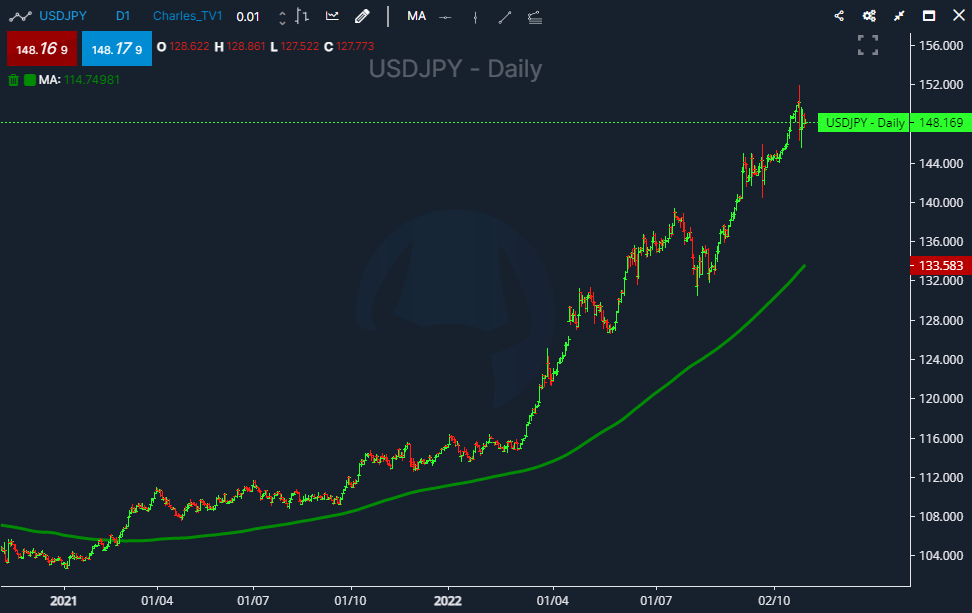
To find value areas, you can use a longer-term MA, such as a 200-day MA. When prices are trading above the 200-day MA, it indicates that the market is in an uptrend. Conversely, when prices are trading below the 200-day MA, it indicates that the market is in a downtrend.
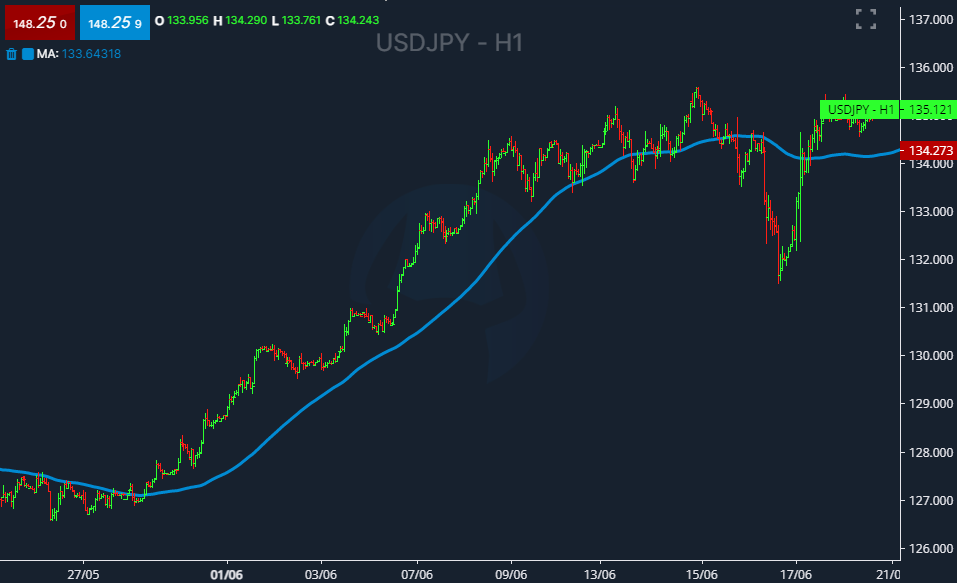
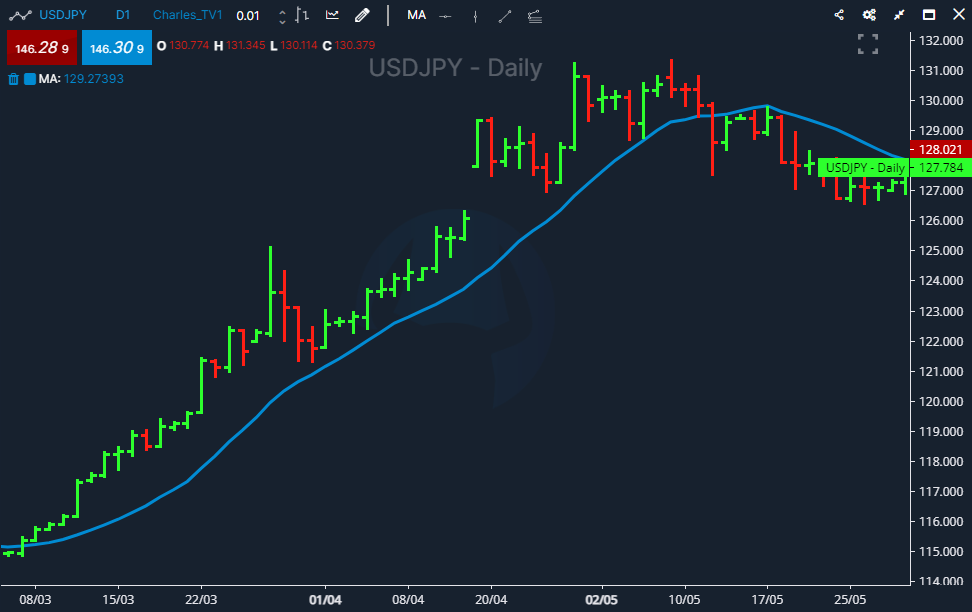
USDJPY Daily trading above the 200ma signaling an uptrend.
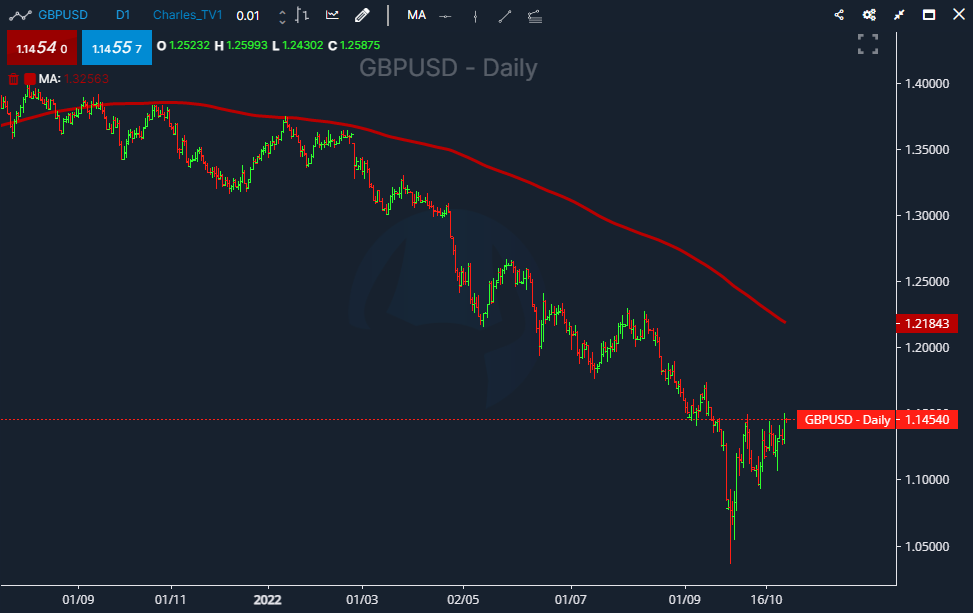
GBPUSD Daily trading below the 200ma signaling a downtrend.
You can then use shorter-term MAs, such as 50-day or 20-day MAs, to identify value areas within the overall trend. For example, if prices are in an uptrend and they pull back to the 50-day MA, that would be a potential value area to buy.
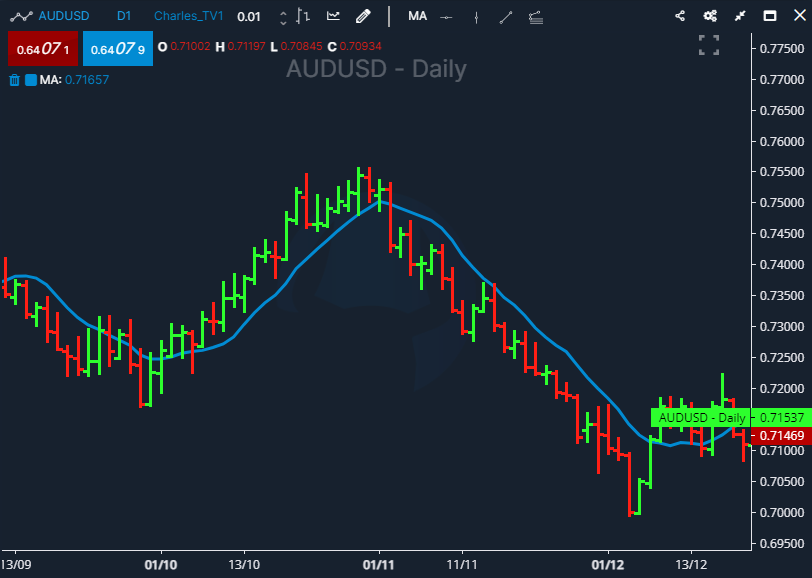
Here you can see that while above the Green 200ma, when the price dips to the Blue 50ma, the chart finds support and continues higher.
USDJPY Daily with an added 50ma (Blue) and 200ma (Green)

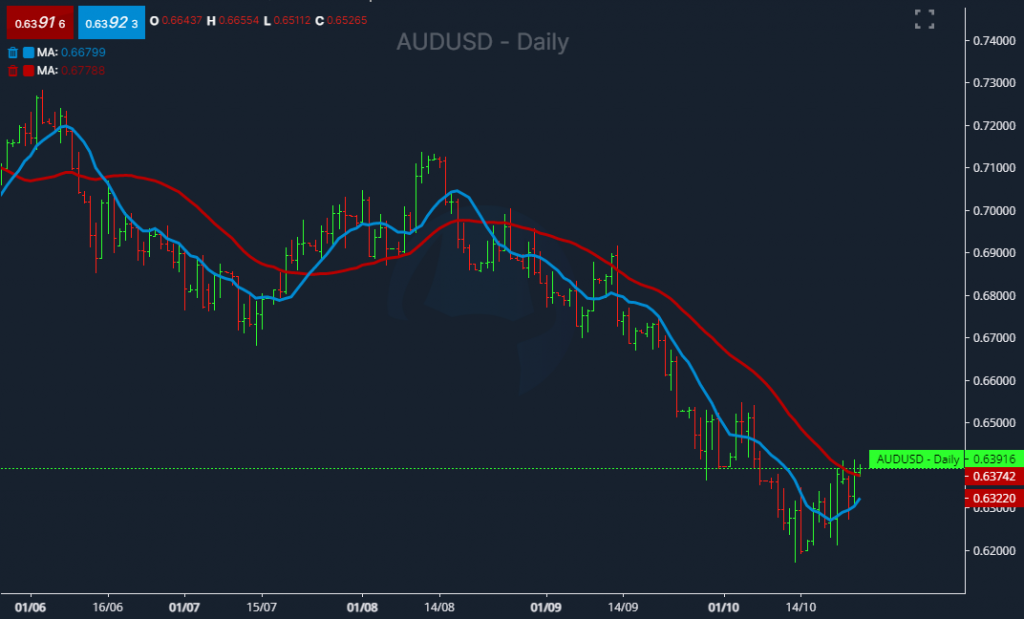
And for the Sell side you can see that while below the Red 200ma, when the price rises to the Blue 50ma, the chart finds resistance and continues lower.
GBPUSD Daily with an added 50ma (Blue) and 200ma (Red)

The key thing to remember is that you want to trade with the trend. So, if prices are in an uptrend, you would look for value areas to buy. And if prices are in a downtrend, you would look for value areas to sell.
How to use MA’s as support and resistance levels
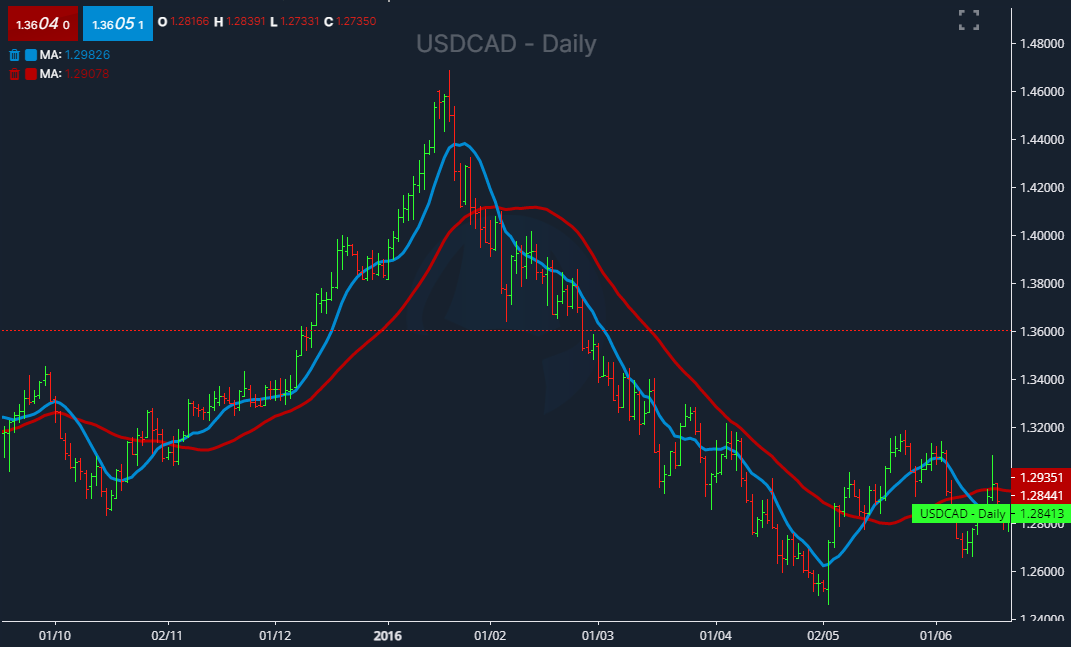
Another way to use moving averages is to identify potential support and resistance levels. This can be done by using a longer-term MA, such as a 200 MA, and then looking for price action around that MA.
If prices continue to bounce off the moving average, it could show a potential support or resistance level, until the moving average price has been broken the trend could continue in this direction.
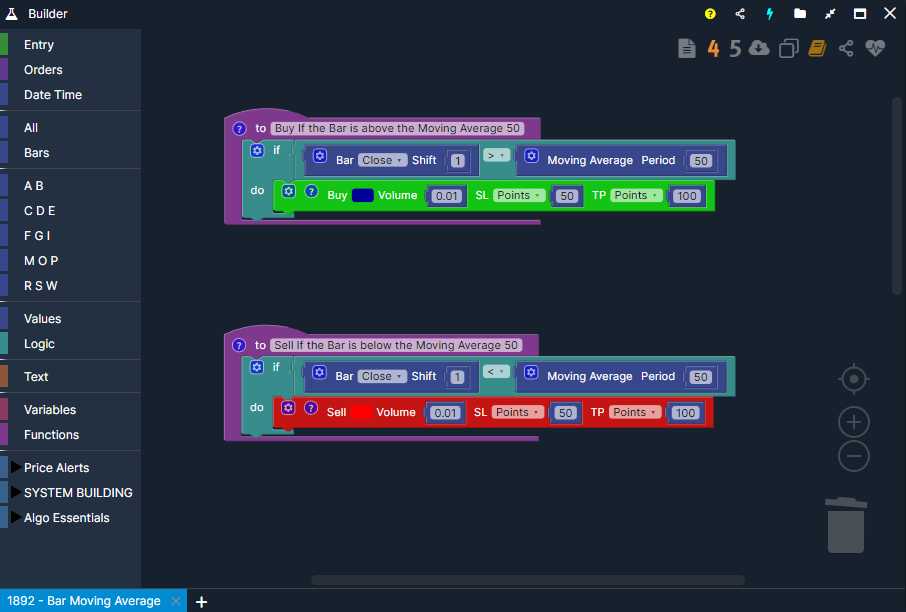
This can be automated with only a few blocks inside X-Builder.
If the bar is above the moving average 50, the system will open a buy trade
If the bar is below the moving average 50, the system will open a sell trade
Automated trading could not be any easier than using Drag & Drop blocks to create your ideas.
How to use MA’s to automatically set your stop loss
Another way to use moving averages is to automatically set your stop loss and take profit levels. This can be done by using a shorter-term MA, such as a 10-day MA, and then setting your stop loss at a certain distance below that MA.
As you can see below, once the 50 MA started to lose its strength the price dropped fast through it.
Using X-Builder you can easily create a stop loss using moving averages, much easier than manually trading a moving average that is constantly moving.
It’s as easy as placing the Moving Average block into the Stop Loss area of the Buy block, this will now set your stop loss to the price of the moving average. It could not be any easier than this.

How to use MA’s to better time your entries and reduce screen time
If you’re trying to time your entries into the market, you can use moving averages to help you. One way to do this is to use a longer-term MA, such as a 200-day MA, and then wait for prices to pull back to that MA before buying.
This is a good way to avoid overbought markets. For example, if prices are in an uptrend and they pull back to the 200-day MA, that would be a good time to buy because the market is likely to resume its uptrend from that point.
A good example for this is within the Crypto markets. Ripple (XRPUSD) is a clear example of how waiting for the 200 MA can be beneficial in your trading strategies.
As many traders had FOMO and bought the tops of the Crypto markets, waiting for the 200 MA could have been a better strategy.

Using Automation you can create a moving average strategy that will wait for the 200 MA on XRPUSD before it starts to Buy.
If the moving average is below the 200 MA, Buy XRPUSD.

How to use Moving Averages to ride massive trends in any markets using a trailing stop loss
If you’re looking for a way to ride massive trends in the markets, then you need to use a trailing stop loss. A trailing stop loss is a dynamic stop loss that moves with the market. As the market moves in your favor, the stop loss moves with it.
This is a great way to stay in trends for as long as possible and maximize your profits. It’s also a good way to avoid getting caught in reversals.
One of the best ways to use a trailing stop loss is with moving averages.
When you use moving averages with a trailing stop loss, you can stay in trends for as long as possible and avoid getting caught in reversals.
Here’s how it works…
How to use a trailing stop loss with moving averages
First, you need to identify the market trend. You can do this by looking at the price action on a chart. If prices are moving up, then the market is in an uptrend. And if prices are moving down, then the market is in a downtrend.
Once you’ve identified the trend, you need to find a moving average that’s in line with that trend. For example, if the market is in an uptrend, you would want to use a moving average that’s rising. And if the market is in a downtrend, you would want to use a moving average that’s falling.
Once you’ve found a moving average that’s in line with the trend, you can use it to place your trailing stop loss. For example, if the market is in an uptrend and you’re using a 15-day moving average, you would want to place your stop loss below the 15-day MA.
As the market moves up, the 15-day MA will rise with it. And as long as the market stays above the 15-day MA, your stop loss will rise with it.
This is a great way to stay in trends for as long as possible and avoid getting caught in reversals.
Conclusion
If you’re looking for a way to ride massive trends in the markets, then you need to use a trailing stop loss. A trailing stop loss is a dynamic stop loss that moves with the market. As the market moves in your favor, the stop loss moves with it.
This is a great way to stay in trends for as long as possible and maximize your profits. It’s also a good way to avoid getting caught in reversals.
Using X-Builder you can automate your moving average trailing stop in a few simple steps.
The below blocks will select all Long positions and move the stop loss to the moving average 15. It could not be any easier than this.

How to use moving averages to find divergences
Moving averages can also be used to find divergences. A divergence occurs when the price action and the moving average line are going in opposite directions.
For example, if prices are making new highs but the moving average line is not, that’s a bearish divergence. And if prices are making new lows but the moving average line is not, that’s a bullish divergence.

Divergences can be used to identify potential reversals in the market. For example, if there’s a bearish divergence and prices start to fall, that could be a sign that the market is about to reverse and head lower.
To find divergences, you need to look at the price action and the moving average line on a chart. If you see that they’re going in opposite directions, then you have a potential divergence.
To automate this in X-Builder you could make something similar to the below which says:
Firstly let’s understand the Shift. Shift means how many bars back to look, in this case the system is looking at shift 1 which is 1 back back, and shift 2, which is 2 bars back. To learn more about the shift please see “Understanding the Shift function”
If the moving average 200, shift 1. Is below the moving average 200, shift 2. (The moving average is moving lower)
If the bar shift 1, is above bar shift 2. (Bullish Bar)

How to create an automated moving averages trading strategy
Using the above ideas and strategies you can very easily create a moving average trading strategy using X-Builder and testing it with the in-built tester, X-Tester, and combining the results into a portfolio to see how all the trading symbols work together. The below is an example of how you can create automated moving average trading strategies without the need to code.
The strategy rules:
When to Buy:
When the Moving Averages cross up, open a Long (Buy) trade and close all Short trades.
When to Sell:
When the Moving Averages cross down, open a Short (Sell) trade and close all Buy trades.

Now that the strategy has been created using blocks you can push it straight to the tester to see the results.
Conclusion:
With a few extra rules and filters the moving average cross strategy could have potential.
Creating a Portfolio using MA’s
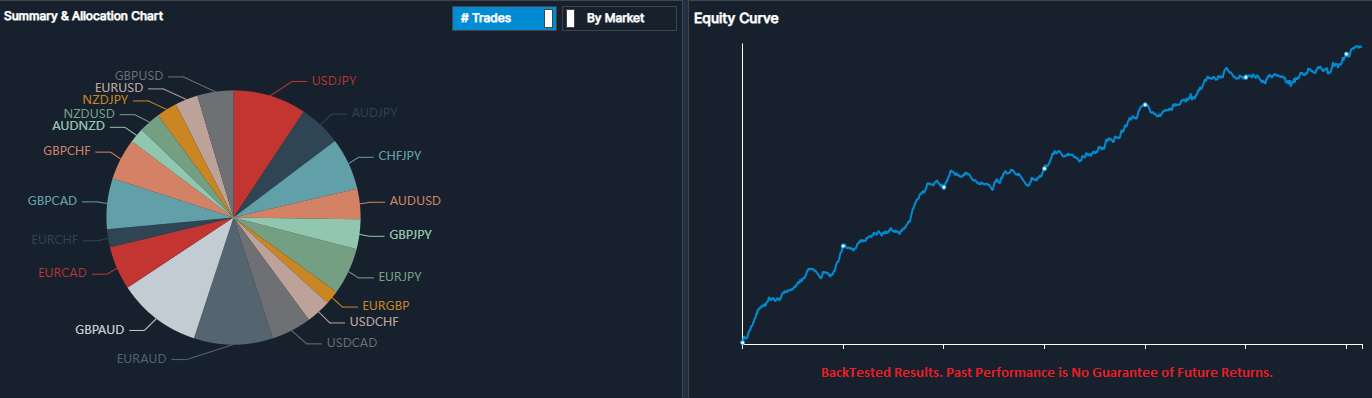
After you have successfully built a moving average strategy and tested this on multiple symbols and timeframes you can build a portfolio inside Trade View X-Analyser to see how your strategy would perform on multiple assets.
The below is an example of a moving averages based strategy that has been built into a portfolio testing on 20 Forex symbols at the same time.
If you would like to learn more about creating automated trading strategies check out the Trading Talk series
Why wait? Get started today. Sign up for an account today with our partnered broker.