
Quantitative easing, widely referred to as QE, is a term most of you may have heard by now. But do you really know what it is? There seems to be a common misconception of its true meaning which we want to debunk, then provide an understanding as to how it affects markets and what you can do about it.
Once you make it through to the end of the article and want to learn more about how an algorithmic trading firm trades market fundamentals, such as QE, we have made this week’s Trading Talk episode, ‘Fundamentals in 2021’, available to purchase for A$9.95.
What is QE?
Contrary to popular belief, Fed Chair Jerome Powell does not sit in his home office (pictured below) with a money-printing machine…
The Reality
To understand QE you need to understand the role of central banks. Examples of central banks include the U.S. Federal Reserve (Fed), Reserve Bank of Australia (RBA), Bank of Japan (BoJ) and European Central Bank (ECB).
A central bank is in charge of the country’s money supply – how much money is circulating in the economy. They have the ability to electronically create money, which is where the term ‘printing money’ comes from, but there are not any new bank notes created.
QE
QE is a last resort process used by Central Banks when facing a recession/depression as they look to push new money into the financial system. They usually do this by purchasing existing government bonds from a financial intermediary such as a commercial bank – this injects money into the banking system, as well as increases the price of bonds.
The ideal outcome is to encourage investment and growth – the banks using the extra ‘reserves’ to lend more in the wider economy (as interest rates on loans are reduced, as bonds increase) to new business and investment. In turn, this should lead to businesses being able to finance new hiring to get people back in work, reducing unemployment.
Does it cause inflation?
One of the main themes of 2021 has been inflation. Due to worldwide lockdowns and economies being closed off, there have been record levels of QE, as well as unprecedented stimulus (such as the U.S. $1,400 bank deposits). Despite this, the data – so far – isn’t showing the inflation that some commentators and economists have been forecasting.
Interestingly, despite ongoing QE in some form since the 2008/09 recession, inflation hasn’t exceeded G7 central banks 2% target inflation. However, the Covid-19 pandemic has seen the amount of QE increase significantly – take a look at this graphic from the Bank of England’s website:
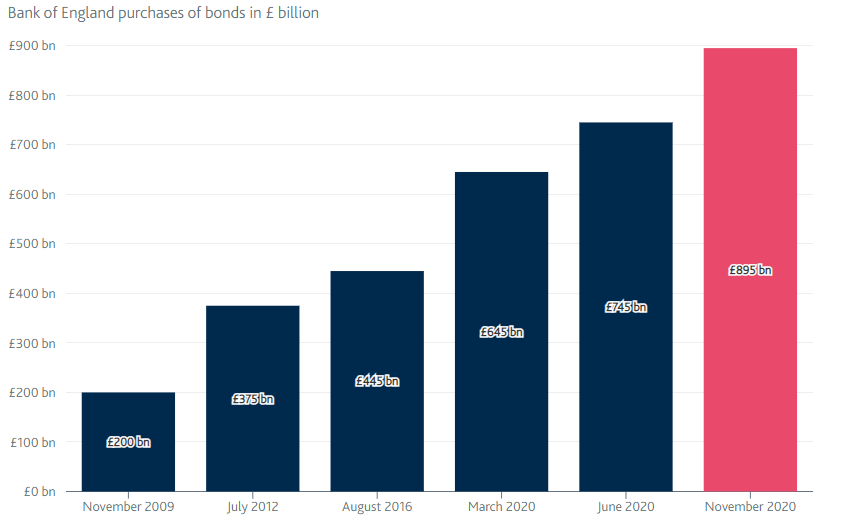
Therefore it’s expected the significant increase in QE since March 2020 will, at some point, show up and higher inflation than the 2% target will arrive – the main question is when.
QE and markets
QE is designed to inflate bond prices which in turn sends bond yields down. Investors then need to rebalance their portfolios by looking for returns in other assets, such as equities. As such, over the past twelve years since the start of QE there has been a positive correlation between the Fed’s QE and the S&P 500, the largest stock market in the U.S.
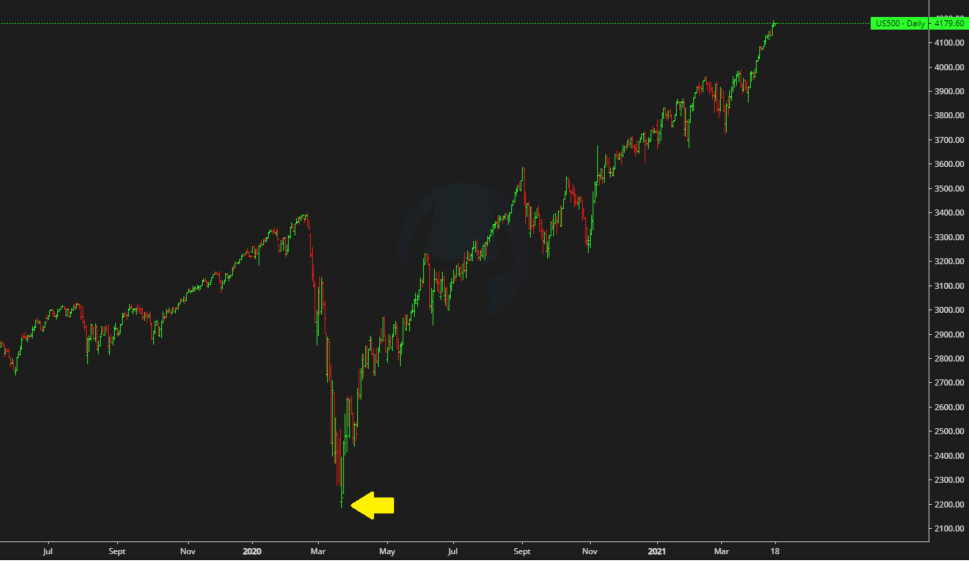
Below is when the Fed announced new and substantial QE measures in March 2020 after the market crash caused by the Covid-19 outbreak:
As QE has been going on now for over a decade, since the GFC, and has even accelerated since the Covid-19 pandemic, many argue stock market prices have been ‘artificially inflated’. That is, they have become detached from their true intrinsic value.
This is backed up by the multiple times the Fed has attempted to ‘taper’ (in other words, slow down/reduce) their QE, causing significant volatility in stock markets. It first came about in 2013 when Ben Bernanke (former Fed chair) announced they would start to taper the bond buying program, which led to fears that the market had been spending too much on asset support from the Fed post financial crisis.
Below you see an example of the volatility caused by QE tapering, combined with the fear of a quick succession of interest rate raising, from late 2018 in the S&P 500:
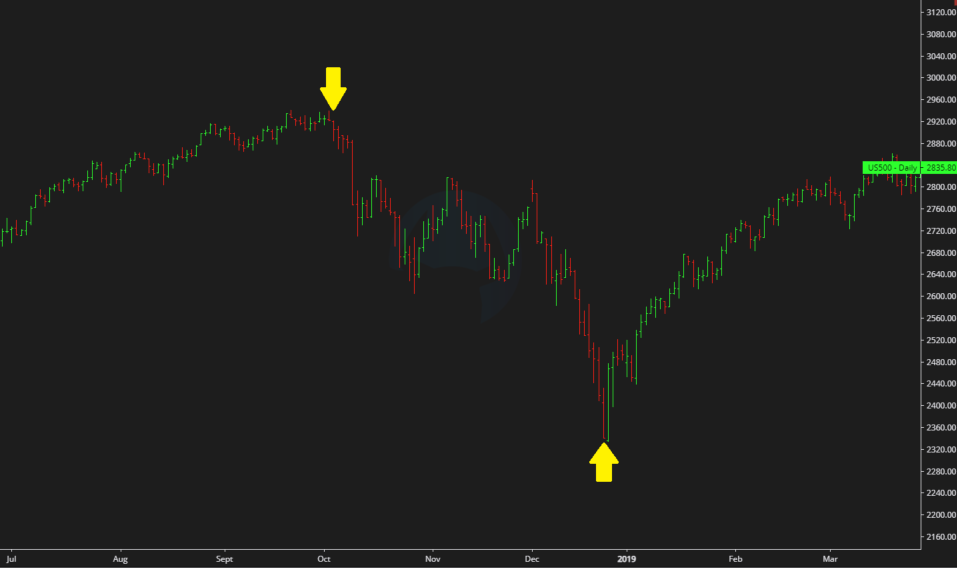
The market moves with investor confidence and there is a concern for the market when this ‘artificial’ liquidity dries up – which it hasn’t done properly since the Global Financial Crisis in 2008. Some of the largest stock market gains in U.S. history have occurred while QE policies have been in place and evidence so far suggests there is a positive correlation between QE and stock market performance:
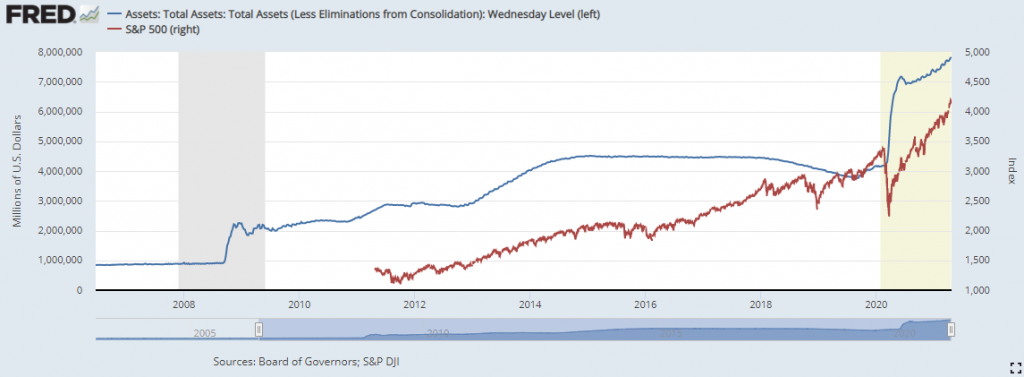
The chart is showing the relationship between the Fed’s balance sheet (which increases with more QE) and the S&P 500.
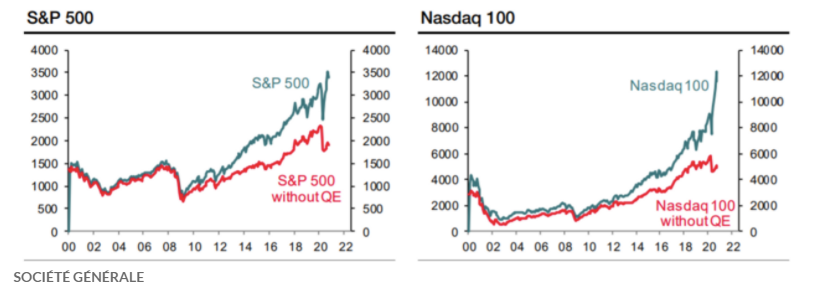
According to analysts at Societe Generale (see below charts) the S&P 500 and Nasdaq would halve without QE:
How can we take advantage?
There is a famous saying ‘Don’t fight the Fed’ – meaning investors should align their choices with the Fed’s actions – so as traders we have to take a step back, recognise where the opportunity lies and then build trading models around it.
Our founder, Robert, replying to our Senior Trader’s comment recently, simplified our approach in the Trade View X Chat:
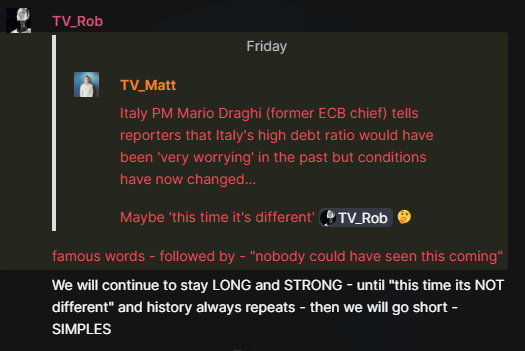
At Trade View we take a systematic approach to trading. Having a mechanical approach is the best way to avoid ’noise’ but we still keep a keen eye on what key themes are at play. As our trading is fully automated, we often get asked – how do you consider and factor in market fundamentals?
In this week’s Trading Talk we will provide an in-depth discussion around this as well as practically show you two example trading systems that you can build and test yourself!
We have made this episode available as part of our ‘Trading Talk essentials’ series that you can buy for $9.95. Please click HERE to access the video.