
US equity markets have moved sideways for the most part of 2015 as we eagerly await the FED’s next move. Markets are expecting a rate hike cycle to begin sometime this year, and the FED has stated they will make a ‘data-driven’ decision but have yet to indicate whether this will be in June, September or even December. So the question now begs – where do the markets go from here? The ‘Sell in May’ adage did not play out as we reached new all-time highs in May. Is this a bullish sign? Our view is to expect continued volatility with higher prices to come, and ultimately a continuation of this bull market which began back in 2009.
It’s often said that one cannot anticipate the future without understanding the past or where we’ve come from. As we move through the markets day by day, we can easily forget the bigger picture and not be astute to what may really be taking place.
Over recent months we’ve seen many reports and experts voicing their concerns that this bull market is coming to an end. In any event, as a firm, we are always thinking about what specific fundamental shift would need to occur for this to happen?
To elaborate on this further – let’s look at some of the major events that are currently playing out in the markets.
- GREXIT
We recently dispelled the myth of a potential Grexit in our last article here. A Greek exit may indeed spell disaster for global markets but this is not in the best interest of capital markets and the ECB knows this and therefore will do everything in its power to prevent such an event from occurring.
- European QE
We also know that as of March this year, the ECB began its bond-buying (Quantitative Easing) program aimed at boosting inflation and stimulating the economy. Europe has finally decided to follow in the footsteps of the US, Britain and Japan. This €1 trillion program is bullish for European equities and astute traders may have previously seen signs of this; particularly in the DAX futures market. Knowing when these central banks are around can be crucial for anyone exposed to these markets, particularly in the short term.
- Pending FED rate hike
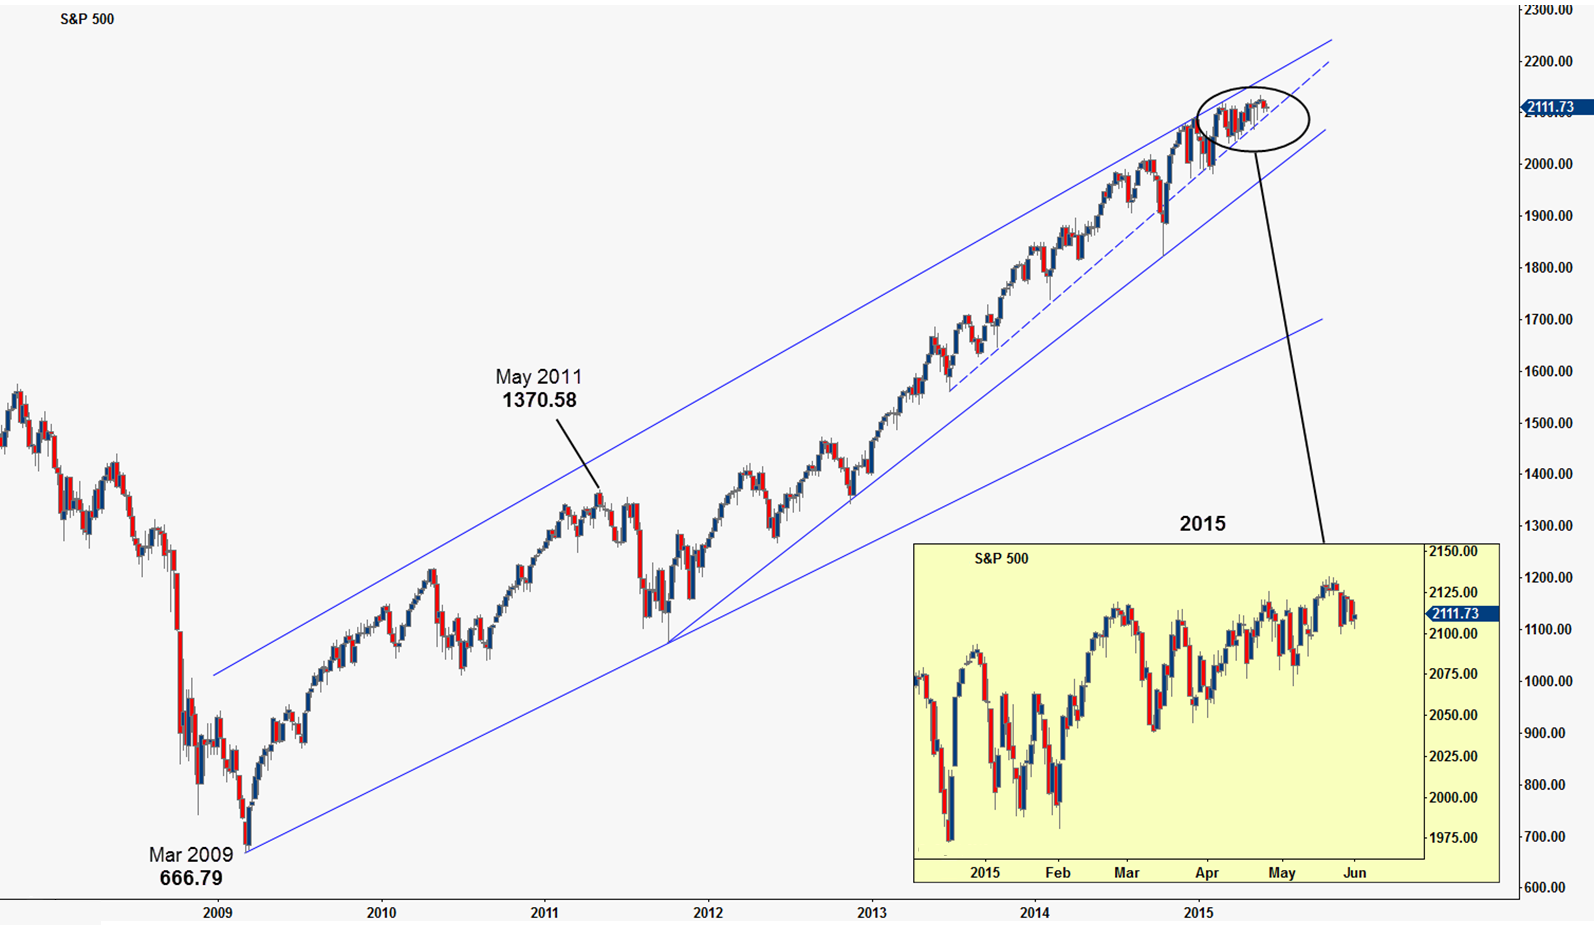
When you consider the chart of the S&P 500 below and the current landscape, it should be of no surprise as to why markets have behaved like they have this year. Markets are forward-looking and act as a discounting mechanism, and we believe the recent volatility is the result of a rate hike being priced later this year.
50% and 100%
Now that we know what is occurring in the markets it is time to do the most important part.
Make a trading decision or decipher the news at hand. To do this we will look at a purely mathematical view.
Keen traders will note the high of 1370 that occurred in May 2011 rallied strongly from the final low in March 2009 of 666. We have seen this many times in the past where an equity market will find support/resistance at a level, only to then double in price before another significant top is in place.
In this instance- the March 2009 low of 666 multiplied by 2 (doubled) gives us 1332. Whilst the final high did overshoot to 1370, we began to see strong selling at this level in February 2011 prior to the May 2011 high (Chart 2)

We can also see the March 2000 high of 1552.87 followed by a final low of 768.3 in October 2002 (if we were to calculate 50% of 1552.87 we get 776, only 8 points shy of the actual low)
Coincidence you say? Maybe not.
Here are some other major examples of the S&P500 over the years:
- 2000 HIGH of 1552.87 – 2002 LOW of 768.63 (50%)
- 2002 LOW of 768 – 2007 HIGH of 1576.09 (100%)
- 1987 HIGH of 337.89 – mid-1996 HIGH of 681.10 (100%)
- 1987 LOW of 216 – 1994 HIGH of 482.85 (100%)
- 1983 HIGH of 172.65 – 1987 HIGH of 337.89 (100%)
The thing we find interesting is that often a doubling in price from major lows and highs is followed by a major move down and in most cases a 50% correction. But this has now changed because the S&P has surpassed the previous highs of 1552.87, therefore we see a new cycle forming where 1552.87 could be the new significant high.
A classic example of this on another Index was seen on the XJO (ASX Top200) Index prior to the Global Financial Crisis. After the Feb 2002 high at 3506.1 was breached, a subsequent high almost double (+95%) this previous price was made at 6851.5 in 2007.
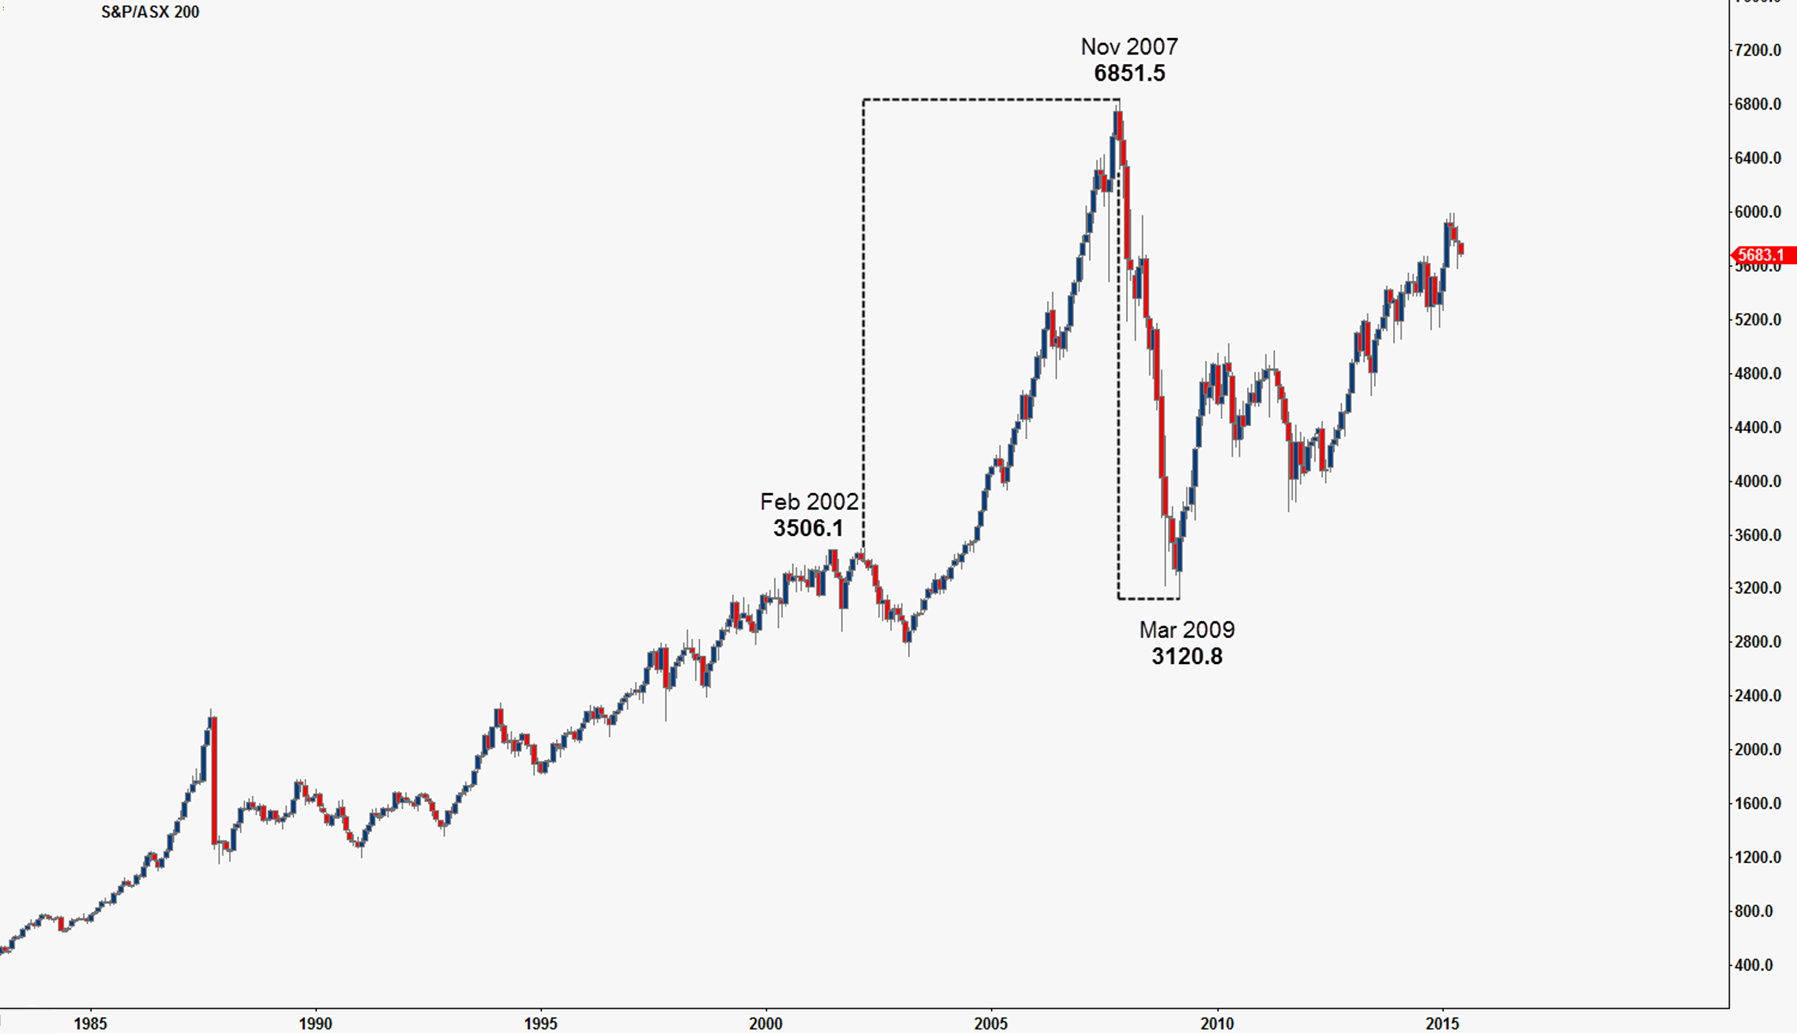
Historically, we would anticipate a 50% correction and we were not disappointed, with the XJO losing 54% of its value.
This phenomenon occurs in many markets over and over again and is something all traders and investors alike should consider very very carefully.
Considering a move to the downside
In taking an objective stance we must also consider what a move to the downside would look like. Should the S&P500 top at current levels, a repeat of its historic nature to correct 50% would give a price around 1067 (from the current all-time highs of 2134.7). Historically, this would be against the norm as we have yet to see a doubling in the price above the previous 2000 and 2007 highs as seen in Chart 2.
We also investigated the percentage move down of every retracement greater than 5% since the start of this bull market post-GFC. By doing this we can better understand what form of downside pressure exists in the market relative to previous moves, and whether these moves down are gaining strength and momentum.
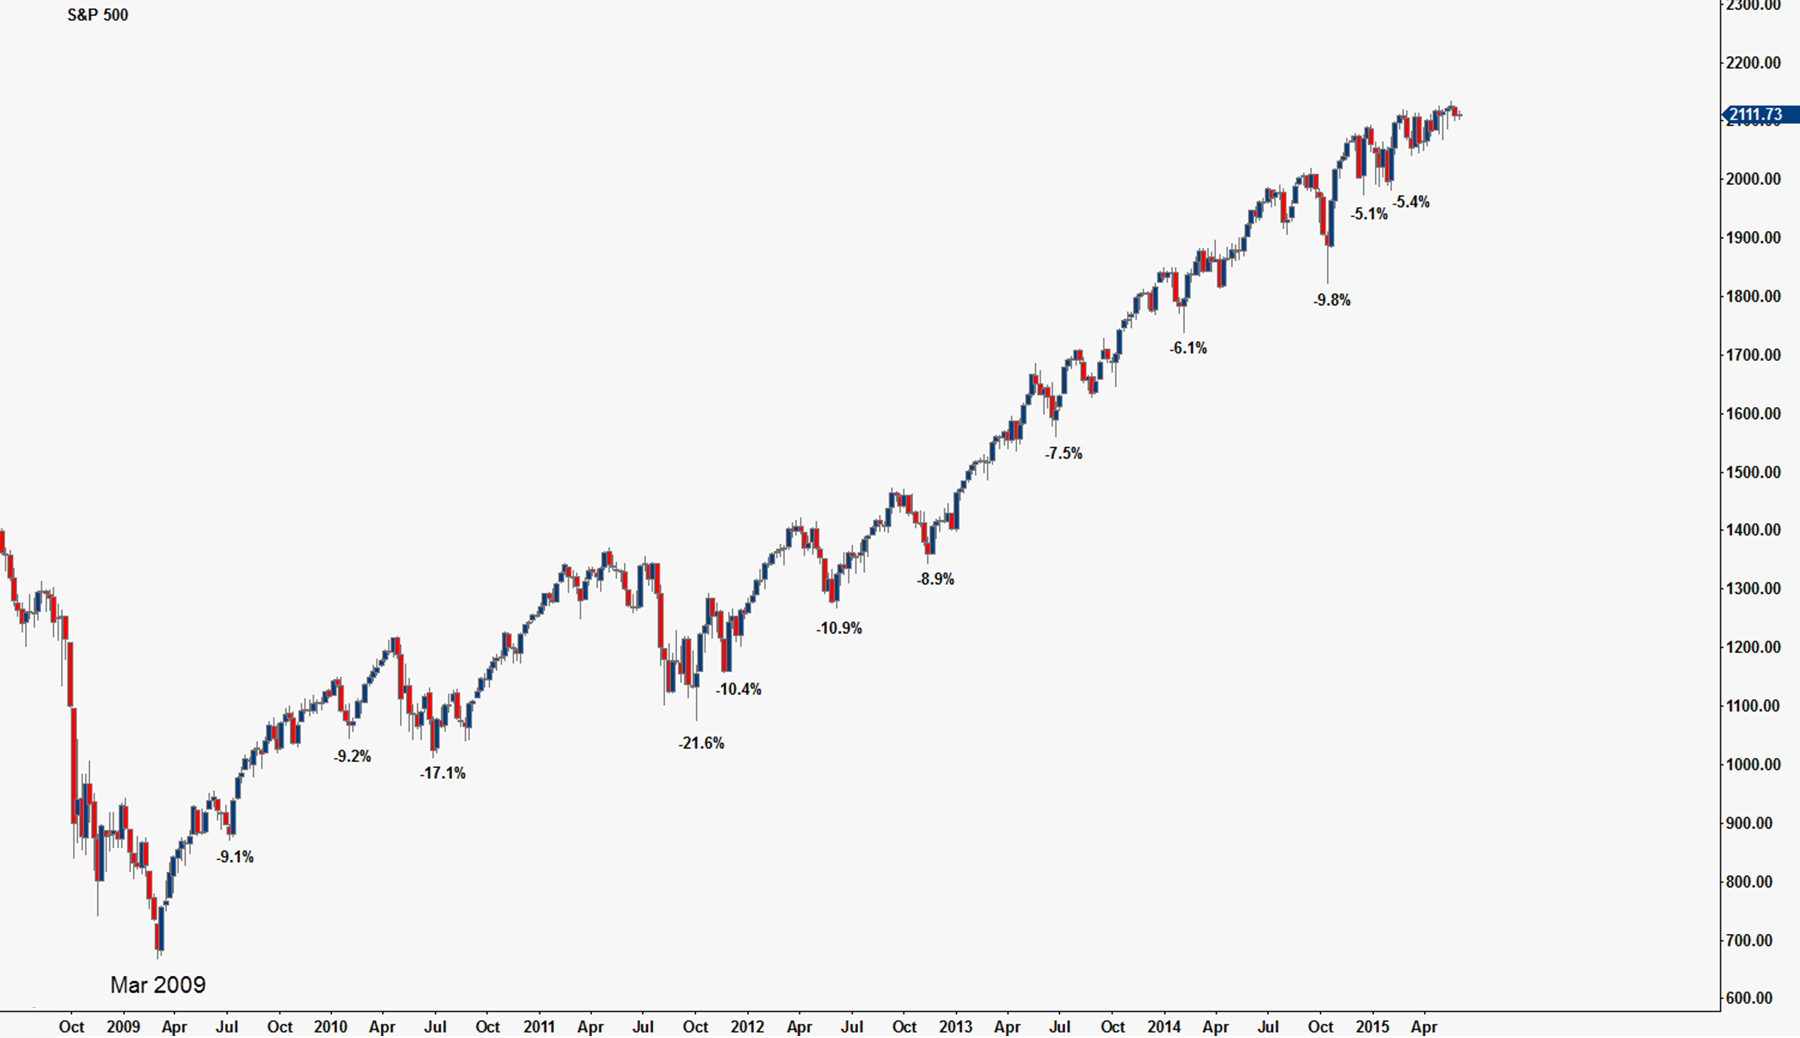
Through careful examination of these moves, we can see orderly corrective moves of similar magnitudes. This shows that every time the market has sold off over the past year or two buyers have stepped in very quickly, with the market rebounding straight back up as all dips are bought. In our view, this is very bullish behaviour.
Conclusion
The last major historic high in the S&P of 1576 (October 2007, pre-GFC) was eclipsed back in 2013 and we are again knocking on the door of higher prices.
Doubling this number gives us 3152. Is this number radical or extreme? It may indeed be.
But if we look to history and consider some simple statistics, the odds favour a much greater move to the upside before this bull market is truly over.
We have seen bears shorting this market and pundits calling for a top all throughout the year. If this bull market is indeed over, the real question we must ask is this:
With all events known to the markets, what event would need to occur for the S&P500 to correct down to 1067? (All-time Highs of 2134.7 divided by 2)
Answer this and you have yourself a 50% correction.
—-
If this article has you thinking, come and see what our professional prop traders think as they call the market as the action unfolds in our LIVE CHAT ROOM for only $19.95 p/month.
If you enjoyed this article or have any questions, please leave us a comment below and don’t forget to follow us on social media for up-to-date posts.
Very interesting perspective and a pretty big call for an extended bull market. I think this is the end but there are valid reasons here having me question otherwise.
I must ask though isn’t an interest rate rise bearish for stocks as the cost of business increasehaving are US companies so well off with large cash reserves that an interest rate rise actually becomes positive for their balance sheets?
What does this mean for the Australian stock market? There has been much weakness as of late. does this mean our bull market will continue higher with the America? You guys really give us great reads all your articles are fantastic, wish there were more. Thanks.
Hi James, from a mathematical point it makes no real sense to correct from current levels. From a fundamental perspective we need to look at the BIG picture (removing all the hype from the media) what is best for the world? Look at it this way (another example) if the US did not extend the fiscal cliff the world we live in now would not exist, the grass is not always greener on the other side. Rob
Thanks for the kind words Prakash. The simple answer to your question is Yes. If the US markets continue to rally the ASX should follow. Rob
If Greece leaves the Euro region which I believe is real possibility, we would be at a top now and could easily head back down. Markets look top heavy and it seems the sellers are much stronger than buyers. Naturally I am a bear but what if the US raises interest rates aggressively? Wouldnt this mean a correction for the stockmarket? Then we could see the S&P much lower.
I completely agree 50% and 100% are important long term levels but I feel the bull market is coming to an end and a top with much lower prices is near! If we factor in the never ending debt bubble all over the world (except for China) this could create a disastrous event. People are also still remember the two wealth destruction periods in the same decade, the tech bubble and global financial crisis.
Is there enough confidence in markets now that we wont see another crisis unfold?