
As an algorithmic trading firm, most of our models make extensive use of technical, statistical, and mathematical concepts towards exploiting an edge in markets. Some markets, such as the S&P500 which is an extremely efficient market as defined by statistical measures and price/volume techniques, respond very well to the use of these tools. Other markets, such as Crude Oil, lack the same efficiency seen in the S&P500; however it offers much higher levels of volatility.
Given the stark difference in efficiency between financial markets around the globe, one thing remains prevalent across them all: the macro landscape.
Today, we will look at some aspects of the current landscape and attempt to explain how we as a proprietary firm look at fundamental factors, and pose some thoughts for you to consider.
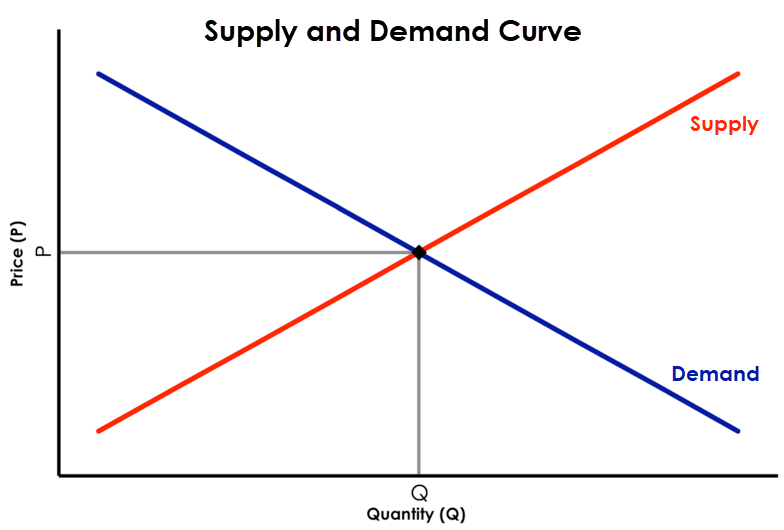
A quick primer – The Law of Supply & Demand
We have all heard of Supply and Demand, one of the immutable laws of microeconomics; perhaps the most basic model of price discovery. All things being equal, it simply states:
For prices to go higher, demand must outweigh supply.
For prices to go lower, supply must outweigh demand.
And where the quantity supplied equals the quantity demanded,
a market is said to be in equilibrium at that price.
Supply and Demand is much more notable in efficient markets where prices remain in equilibrium for longer duration of time.
Why is this important?
In this article, you will see how supply and demand affects many aspects of fundamental data, and how it serves as a basic model for price determination; providing us with a simple fundamental model to look at the macro picture.
Where is the Supply, where is the Demand?
It’s no secret that the demand for stocks has been bellowing for many years now. Amidst the global asset space, stocks have outperformed every other major asset class since the global financial crisis (GFC) and the question now is how long can this continue?
From a fundamental perspective- prices should continue to rise so long as demand outweighs supply. For many years this has and continues to be the case, none more so evident than with companies who engage in share buybacks (or repurchases). This helps drive prices as higher as companies remove supply from the market. Conversely, the large Oil glut we have seen since post GFC resulted in sharply lower prices as hundreds of thousands of barrels sit in refineries and storage. This continues to this day and fundamentalists may argue this as the reason for depressed oil prices.
The same can be said for many other commodity markets too. One such commodity that always causes a commotion is Gold. On one hand you have fundamentals that make a case for much higher prices in Gold, based on the asset’s intrinsic value and ‘flight to safety’ status especially in times of crisis (or a pending crisis). On the other hand, others will argue there is plenty of Gold in the earth. And as technology improves and we mine deeper into the earth, the cost of mining should reduce thus lowering supply costs.
To put this into perspective, it took approximately 5000 workers to produce the same tonnage of steel in the 1950’s compared to just 400 workers today!
In summary, Supply is the supply of labour and resources, whereas demand can be viewed as consumption (personal, business, government).
Which brings us to an important point- the COST of an asset and one of the most pivotal factors of a market’s mechanism: The currency it’s priced in.
Enter the US Dollar
As the global reserve currency, the impact of the US Dollar on financial markets has always had a long-term fundamental impact.
The next chart may be a little new and controversial to some of you, but our analysis below shows conclusive evidence that an increase in rates often precedes a major economic crisis:

Given we are in a current rate hike cycle at the moment, the chart above is a simple example of how long-term fundamentals can help simplify the large and complex macroeconomic environment.
The question now is- what impact will a rising US dollar have in the fundamental space (based on the assumption that if rates go up, the dollar goes up due to the interest earned by holding that currency)?
Trade Wars are here
One of the biggest impacts of trade is the exchange rate of a currency. As the world’s reserve currency, major international deals are conducted in US dollars and it’s exchange rate obviously has a significant impact on trade agreements. But today there is a bigger theme in play and that is the ongoing trade war between the US and China.
At the time of writing, the US has just imposed another round of tariffs on China ($50 billion) and yesterday threatened another $200 billion!
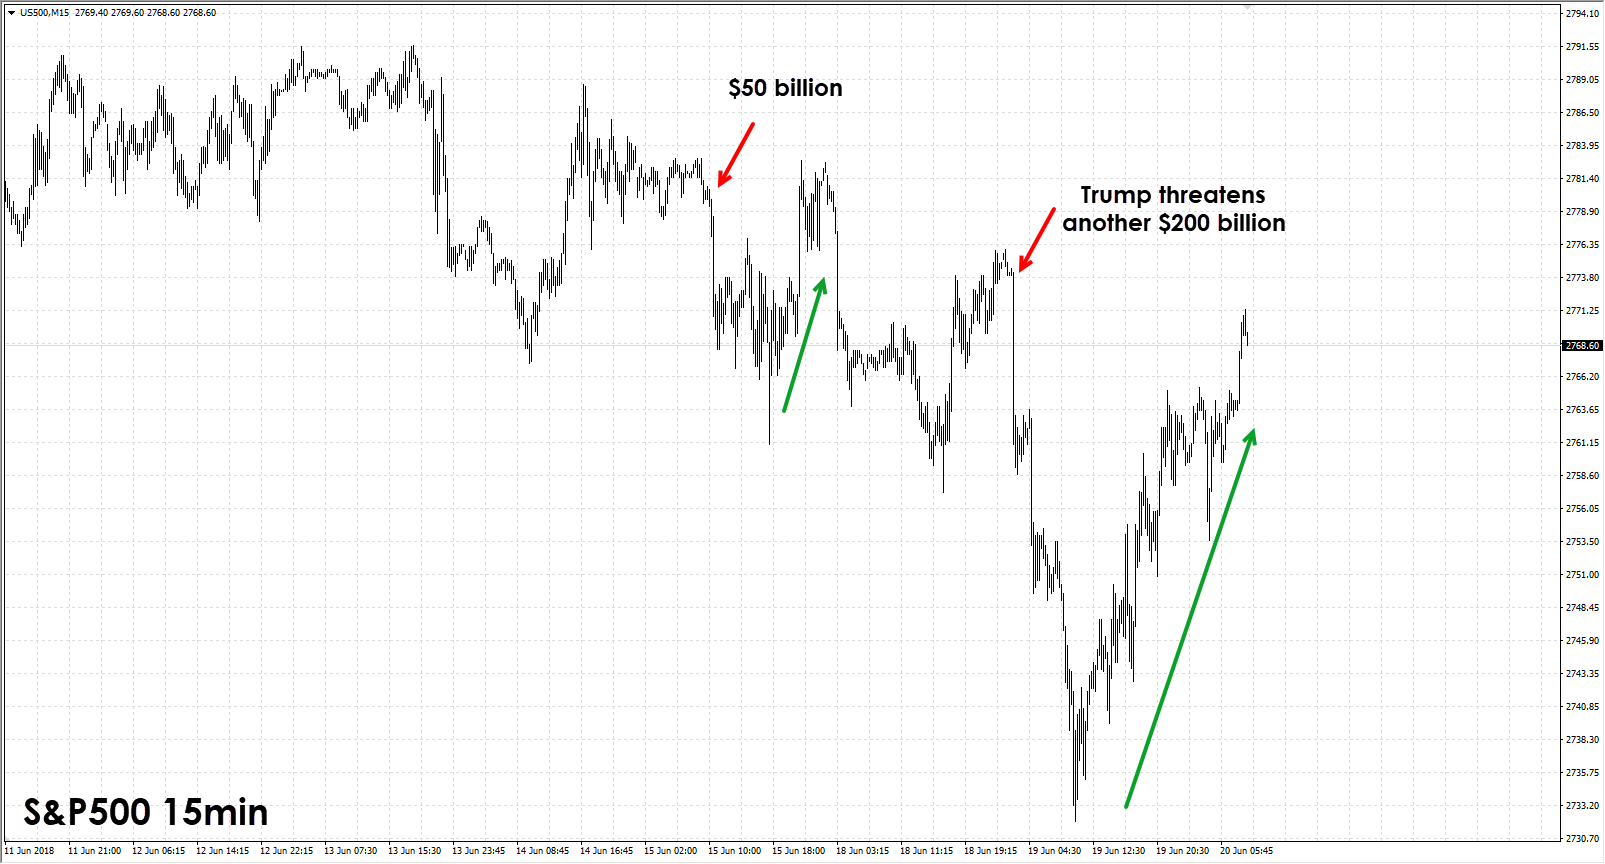
We can see that the fundamental impact of both announcements caused a significant move down in markets but also the same reaction once US markets opened.
It’s clear that Trump is prepared to go toe for toe with China and force a hard line agenda- but how much can China stomach before retaliating?
If farmers and energy companies can (either by choice or through natural causes) limit the supply of their products, could China potentially do the same?
Possibly.
Trade Agreements which have been in place for many years are now starting to wear thin on some nations, particularly the US and for Donald Trump.
These trade agreements are in place to reduce costs and increase both countries’ GDP.
GD what?
Gross Domestic Product measures a nation’s productivity and how much a nation can produce (goods and services).
For most nations, this is measured both quarterly and annually. As traders, this is important to us as it is a big picture signal on the health of an economy.
Positive GDP indicates a nation’s growth rate is on the rise; whilst negative GDP is often cited as a major fundamental cause of recession.
Some of the world’s biggest producers include the US, China and Germany.
But once again the law of supply and demand has played a big part in moving this shift towards China. How so you ask? China controls A LOT OF SUPPLY.
Things are OK, we have Inflation!
Earlier we noted that if demand is greater than supply, prices should rise. This is known as inflation. In most developed markets inflation is hard to clamp down; however in recent years governments and policy makers have failed to reach inflation targets as consumers and businesses seek cheaper/alternative ways to spend their money.
Ultimately, this creates pressure on prices of goods and services to rise; and forces sellers to lower their prices in order to compete. This general reduction and lowering of prices is known as ‘deflation’; and is another contributor to negative growth, market recessions and ultimately bear markets.
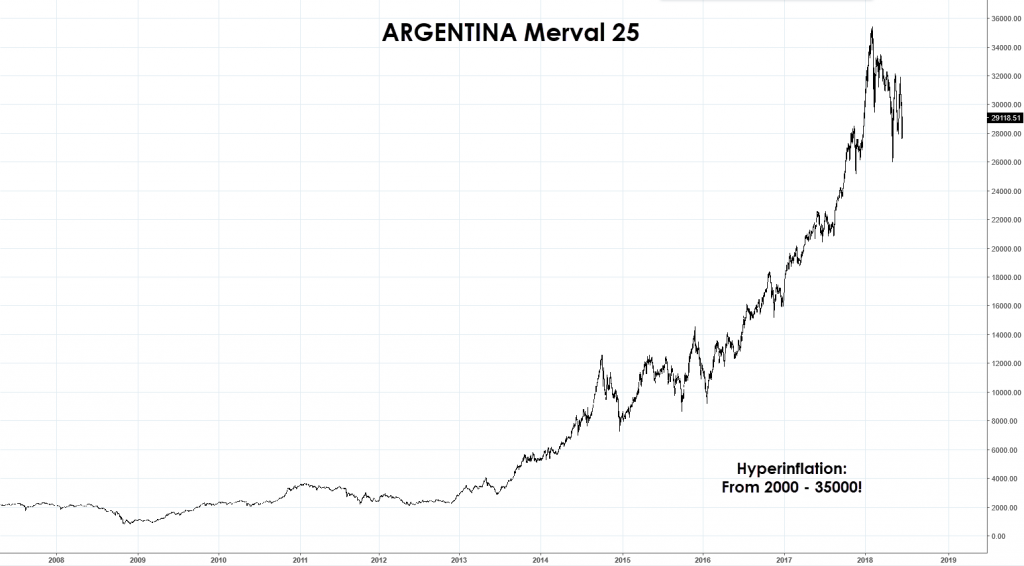
At present most developed countries are showing low-inflation with steady growth. Some countries such as Argentina and Venezuela are in the late stages of an extended period of hyperinflation and the impact this has had on their markets is not be taken lightly:
On the other end of the scale is Saudi Arabia and other countries in the Middle East, which have been experiencing deflation- and we can see a vastly different picture to world market

So is it only businesses and consumers that determine inflationary cycles and economic growth? We now know that businesses create growth through supply, and consumers inflate prices through demand.
But governments and monetary institutions also play a major role…
Fiscal Policy, Budgets and Surplus
A major aspect of any government is its budget and therefore its respective fiscal policy, which outlines how they will generate revenue, how it will be spent, and how the government will stimulate, guide or curb its economy into the future.
In most governments spending typically outpaces revenue, and when this occurs it is known as a budget deficit. The opposite to this is obviously a budget surplus; and the importance to the market is also noted by many participants.
Large deficits need to be financed and the 1000 pound elephant right now is the ongoing US deficit fiasco. To deal with this deficit, governments will usually issue bonds and in some cases- simply print more money.
When a government issues bills, notes and bonds with a yield (interest) that is paid out over a certain period of time.
Government bonds are deemed safer than other types of bonds as most creditors believe a government is highly likely to repay its creditors (rather than default); which in-turn makes these assets attractive.
However- this influx of bonds however means there is now more supply of a country’s currency; therefore the value of that currency should decline. As we explained previously- when supply is greater than demand prices should fall.
Given that the US dollar is used for most international transactions, the US has historically been afforded the luxury to run at a larger debt and deficit than any other country.
A quick look at this deficit by years shows some interesting points:

Since 1929:
- The US Budget deficit remained below 3 percent of its GDP
- It exceeded that ratio during periods of war and recessions
- Once wars and recessions ended, deficit-GDP ratios returned to normal
So whilst the US does indeed have an unfathomable amount of debt, the economy and its markets have seen far more challenging times.
Perhaps the real test will be during the next crisis……? Remember, interest rates are rising!
Let’s not forget about the Central Banks – Monetary Policy
Monetary Policy is set by central banks, who use an arsenal of tools to control inflation and stimulate the economy.
Historically, the pricing of interest rates has been the main driver behind monetary policy, however central bank intervention, the use of credit and banking system policies are also used to control the supply of money in today’s markets.
On the desk, we meticulously follow the actions of central banks as their actions have a very significant impact on markets; both for the short term and long term.
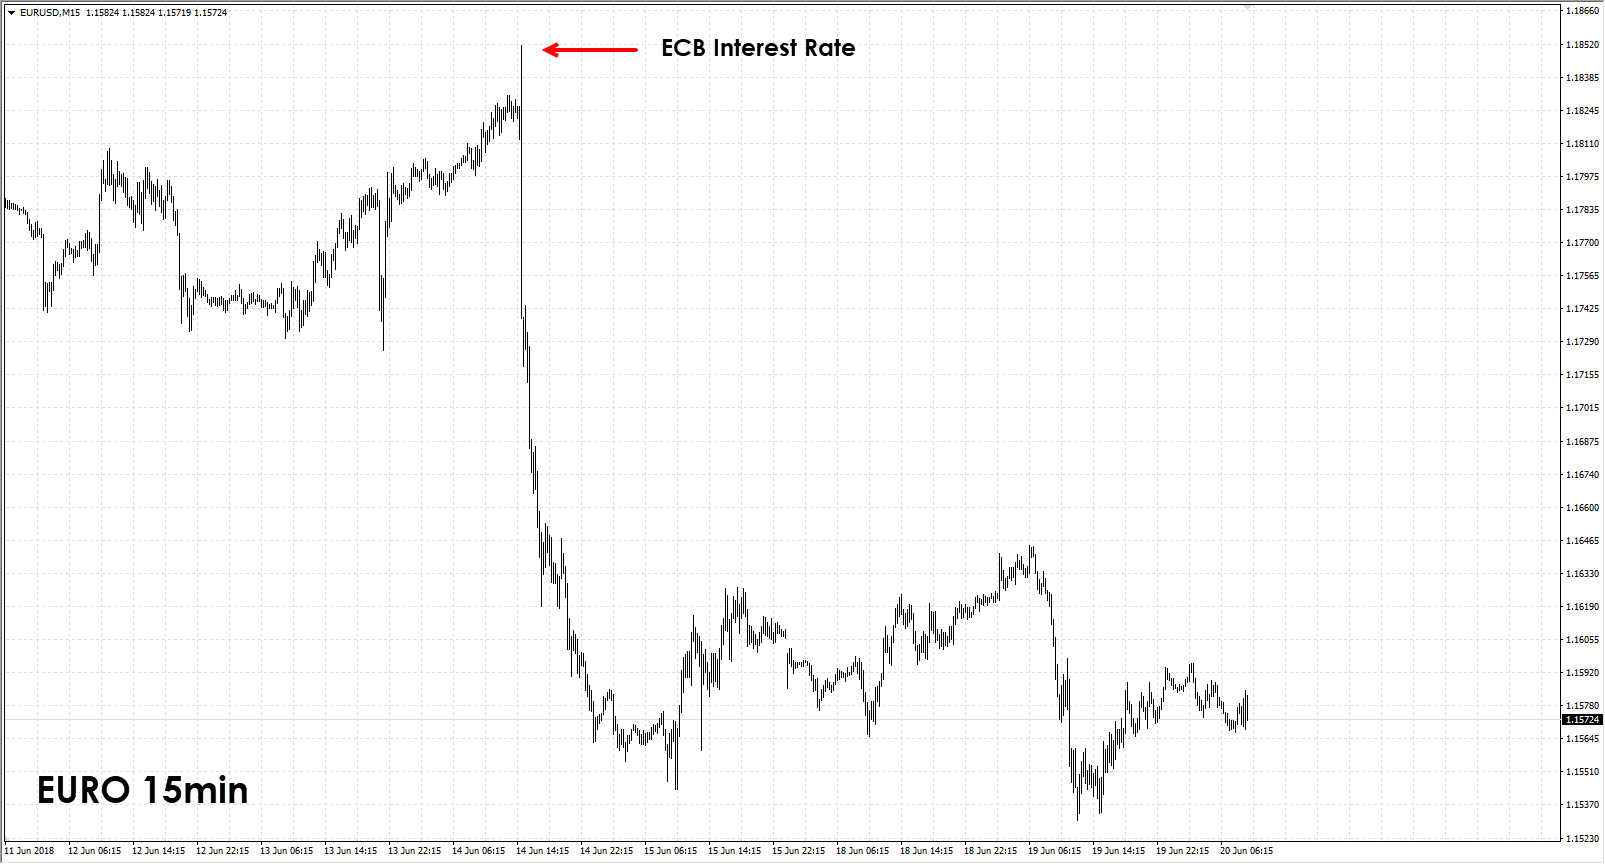
A classic example was last Thursday’s ECB Press Conference- where Mario Draghi confirmed tapering would begin in December. At the time we believe this was priced in as the markets were aware this was coming.
What was not priced in was Draghi’s comments that a Euro rate hike would not come before mid 2019, and the EURO was obliterated on this announcement falling over 2% into the next morning!
Armed with this information, could you now build your own perspectives and models using fundamental concepts and analysis?
Leave a comment below and tell us what you think.